| Research article |
|


|
|
|
| Meteorological drought in semi-arid regions: A case study of Iran |
Hushiar HAMARASH1,*( ), Rahel HAMAD1, Azad RASUL2 ), Rahel HAMAD1, Azad RASUL2 |
1Scientific Research Center, Soran University, Soran 44008, Iraq
2Faculty of Arts, Department of Geography, Soran University, Soran 44008, Iraq |
|
|
|
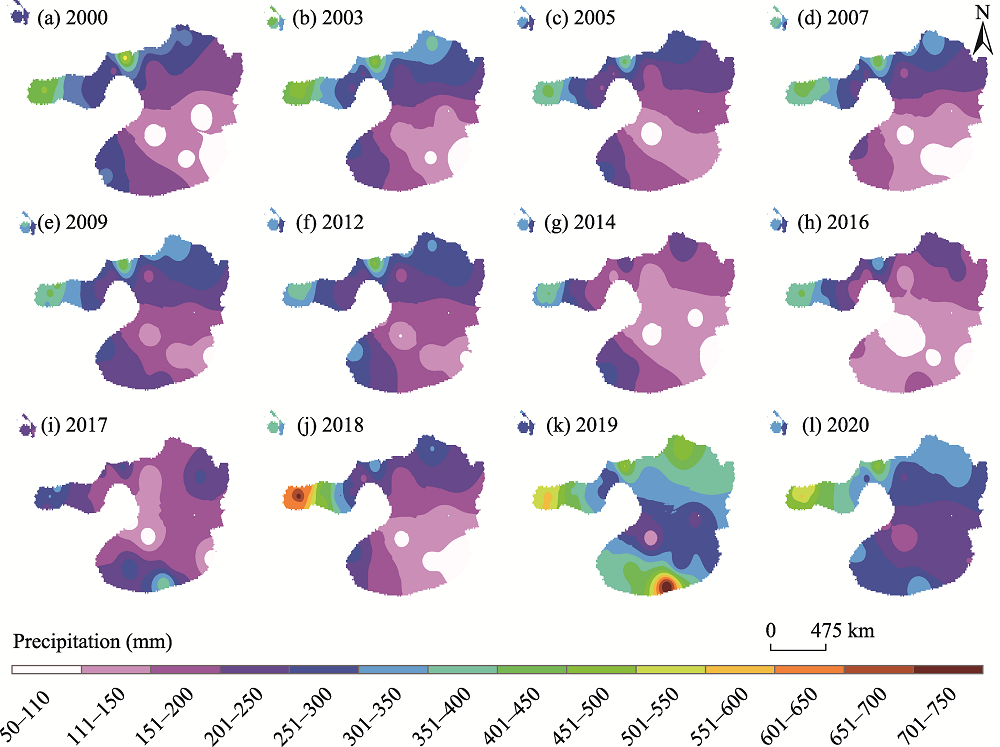
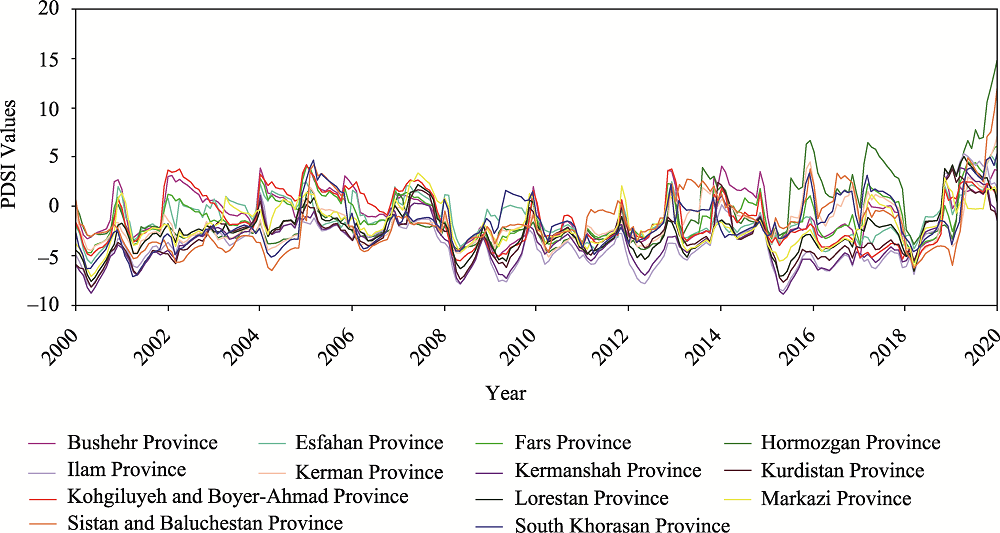
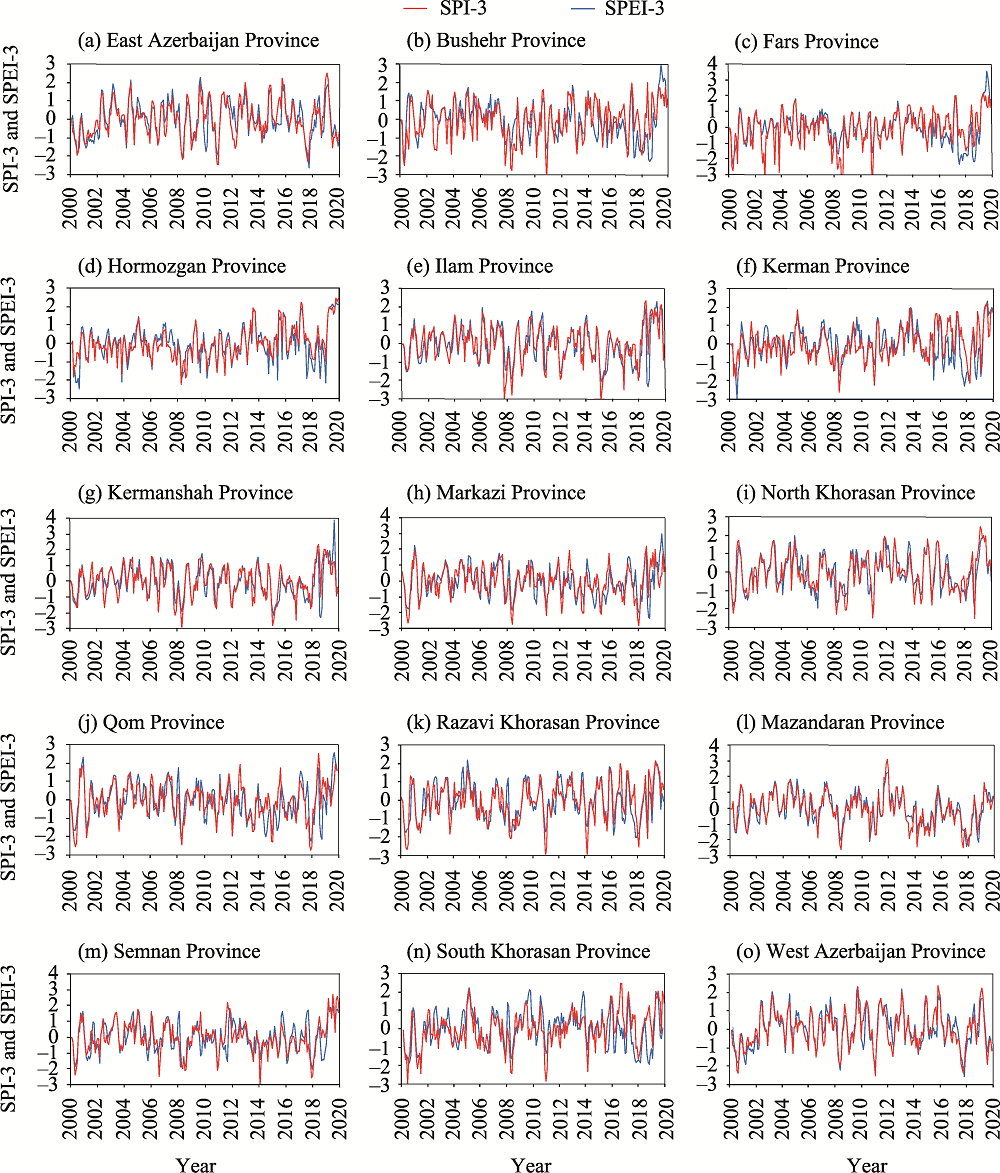
Abstract Drought occurs in almost all climate zones and is characterized by prolonged water deficiency due to unbalanced demand and supply of water, persistent insufficient precipitation, lack of moisture, and high evapotranspiration. Drought caused by insufficient precipitation is a temporary and recurring meteorological event. Precipitation in semi-arid regions is different from that in other regions, ranging from 50 to 750 mm. In general, the semi-arid regions in the west and north of Iran received more precipitation than those in the east and south. The Terrestrial Climate (TerraClimate) data, including monthly precipitation, minimum temperature, maximum temperature, potential evapotranspiration, and the Palmer Drought Severity Index (PDSI) developed by the University of Idaho, were used in this study. The PDSI data was directly obtained from the Google Earth Engine platform. The Standardized Precipitation Index (SPI) and the Standardized Precipitation Evapotranspiration Index (SPEI) on two different scales were calculated in time series and also both SPI and SPEI were shown in spatial distribution maps. The result showed that normal conditions were a common occurrence in the semi-arid regions of Iran over the majority of years from 2000 to 2020, according to a spatiotemporal study of the SPI at 3-month and 12-month time scales as well as the SPEI at 3-month and 12-month time scales. Moreover, the PDSI detected extreme dry years during 2000-2003 and in 2007, 2014, and 2018. In many semi-arid regions of Iran, the SPI at 3-month time scale is higher than the SPEI at 3-month time scale in 2000, 2008, 2014, 2015, and 2018. In general, this study concluded that the semi-arid regions underwent normal weather conditions from 2000 to 2020. In a way, moderate, severe, and extreme dry occurred with a lesser percentage, gradually decreasing. According to the PDSI, during 2000-2003 and 2007-2014, extreme dry struck practically all hot semi-arid regions of Iran. Several parts of the cold semi-arid regions, on the other hand, only experienced moderate to severe dry from 2000 to 2003, except for the eastern areas and wetter regions. The significance of this study is the determination of the spatiotemporal distribution of meteorological drought in semi-arid regions of Iran using strongly validated data from TerraClimate.
|
|
Received: 26 June 2022
Published: 30 November 2022
|
|
Corresponding Authors:
*Hushiar HAMARASH (E-mail: hrh670h@src.soran.edu.iq)
|
|
|
| [1] |
Abatzoglou J T, Dobrowski S Z, Parks S A, et al. 2018a. TerraClimate, a high-resolution global dataset of monthly climate and climatic water balance from 1958-2015. [2022-05-01]. https://www.climatologylab.org/TerraClimate.html.
|
|
|
| [2] |
Abatzoglou J T, Dobrowski S Z, Parks S A, et al. 2018b. TerraClimate, a high-resolution global dataset of monthly climate and climatic water balance from 1958-2015. Scientific Data, 5: 170191, doi: 10.1038/sdata.2017.191.
doi: 10.1038/sdata.2017.191
|
|
|
| [3] |
Abatzoglou J T, Dobrowski S Z, Parks S A, et al. 2021. TerraClimate Individual years for +2C and +4C climate futures. [2022-09-08]. https://samapriya.github.io/awesome-gee-community-datasets/projects/terraclim/.
|
|
|
| [4] |
Abdelmigid H M, Baz M, AlZain M A, et al. 2022. Spatiotemporal deep learning model for prediction of Taif Rose phenotyping. Agronomy, 12(4): 807, doi: 10.3390/agronomy12040807.
doi: 10.3390/agronomy12040807
|
|
|
| [5] |
Alijanian M, Rakhshandehroo G R, Mishra A, et al. 2019. Evaluation of remotely sensed precipitation estimates using PERSIANN-CDR and MSWEP for spatio-temporal drought assessment over Iran. Journal of Hydrology, 579: 124189, doi: 10.1016/j.jhydrol.2019.124189.
doi: 10.1016/j.jhydrol.2019.124189
|
|
|
| [6] |
Allen R G, Pereira L S, Raes D, et al. 1998. Crop evapotranspiration-guidelines for computing crop water requirements. In: FAO Irrigation & Drainage Paper No. 56. Rome, Italy.
|
|
|
| [7] |
Andreadis K M, Clark E A, Wood A W, et al. 2005. Twentieth-century drought in the conterminous United States. Journal of Hydrometeorology, 6(6): 985-1001.
doi: 10.1175/JHM450.1
|
|
|
| [8] |
Araneda R J, Puertas J, Maia R, et al. 2020. Unified framework for drought monitoring and assessment in a transboundaryriver basin. In: Uijttewaal W, Franca M, Valero D, et al. River Flow (1st ed.). London: CRC Press. 1081-1086.
|
|
|
| [9] |
Banimahd S A, Khalili D. 2013. Factors influencing Markov chains predictability characteristics, utilizing SPI, RDI, EDI and SPEI drought indices in different climatic zones. Water Resources Management, 27(11): 3911-3928.
doi: 10.1007/s11269-013-0387-z
|
|
|
| [10] |
Bari Abarghouei H, Asadi Zarch M A, Dastorani M T, et al. 2011. The survey of climatic drought trend in Iran. Stochastic Environmental Research and Risk Assessment, 25(6): 851-863.
doi: 10.1007/s00477-011-0491-7
|
|
|
| [11] |
Beyaztas U, Arikan B B, Beyaztas B H, et al. 2018. Construction of prediction intervals for Palmer Drought Severity Index using bootstrap. Journal of Hydrology, 559: 461-470.
doi: 10.1016/j.jhydrol.2018.02.021
|
|
|
| [12] |
Chen F W, Liu C W. 2012. Estimation of the spatial rainfall distribution using inverse distance weighting (IDW) in the middle of Taiwan. Paddy and Water Environment, 10(3): 209-222.
doi: 10.1007/s10333-012-0319-1
|
|
|
| [13] |
Darand M. 2015. Drought monitoring in Iran by palmer severity drought index (PDSI) and correlation with oceanic atmospheric teleconnection patterns. Geographical Research, 29(4): 67-82.
|
|
|
| [14] |
Dash B K, Rafiuddin M, Khanam F, et al. 2012. Characteristics of meteorological drought in Bangladesh. Natural Hazards, 64(2): 1461-1474.
doi: 10.1007/s11069-012-0307-1
|
|
|
| [15] |
Dehghan S, Salehnia N, Sayari N, et al. 2020. Prediction of meteorological drought in arid and semi-arid regions using PDSI and SDSM: a case study in Fars Province, Iran. Journal of Arid Land, 12(2): 318-330.
doi: 10.1007/s40333-020-0095-5
|
|
|
| [16] |
Guo H, Bao A M, Liu T, et al. 2017. Meteorological drought analysis in the Lower Mekong Basin using satellite-based long-term CHIRPS product. Sustainability, 9(6): 901, doi: 10.3390/su9060901.
doi: 10.3390/su9060901
|
|
|
| [17] |
Hamarash H R, Rasul A, Hamad R O, et al. 2022. A review of methods used to monitor and predict droughts. Preprints, 2022080539, doi: 10.20944/preprints202208.0539.v1.
doi: 10.20944/preprints202208.0539.v1
|
|
|
| [18] |
Hamed M M, Nashwan M S, Shahid S. 2021. Performance evaluation of reanalysis precipitation products in Egypt using fuzzy entropy time series similarity analysis. International Journal of Climatology, 41(11): 5431-5446.
doi: 10.1002/joc.7286
|
|
|
| [19] |
Hossein Z L, Reza F H, Fardin B. 2014. Evaluation of the wheat agricultural drought return period in the province of Fars using RDI index. Journal of Water Resources Engineering, Islamic Azad University, 7(22): 1-10.
|
|
|
| [20] |
Huerta A, Lavado W, Rau P. 2020. The vulnerability of water availability in Peru due to climate change: A probabilistic Budyko analysis. [2022-09-08]. https://ui.adsabs.harvard.edu/abs/2020EGUGA.22.3766H/abstract.
|
|
|
| [21] |
Karakani E G, Malekian A, Gholami S, et al. 2021. Spatiotemporal monitoring and change detection of vegetation cover for drought management in the Middle East. Theoretical and Applied Climatology, 144(1): 299-315.
doi: 10.1007/s00704-021-03543-x
|
|
|
| [22] |
Karl T R. 1983. Some spatial characteristics of drought duration in the United States. Journal of Applied Meteorology and Climatology, 22(8): 1356-1366.
|
|
|
| [23] |
Kazemzadeh M, Malekian A. 2016. Spatial characteristics and temporal trends of meteorological and hydrological droughts in northwestern Iran. Natural Hazards, 80(1): 191-210.
doi: 10.1007/s11069-015-1964-7
|
|
|
| [24] |
Kheyri R, Mojarrad F, Masompour J, et al. 2021. Evaluation of drought changes in Iran using SPEI and SC-PDSI. The Journal of Spatial Planning, 25(1): 175-206.
|
|
|
| [25] |
Kodandapani N, Parks S A. 2019. Effects of drought on wildfires in forest landscapes of the Western Ghats, India. International Journal of Wildland Fire, 28(6): 431-444.
doi: 10.1071/WF18188
|
|
|
| [26] |
Kousari M R, Dastorani M T, Niazi Y, et al. 2014. Trend detection of drought in arid and semi-arid regions of Iran based on implementation of reconnaissance drought index (RDI) and application of non-parametrical statistical method. Water Resources Management, 28(7): 1857-1872.
doi: 10.1007/s11269-014-0558-6
|
|
|
| [27] |
Liu C H, Yang C P, Yang Q, et al. 2021. Spatiotemporal drought analysis by the standardized precipitation index (SPI) and standardized precipitation evapotranspiration index (SPEI) in Sichuan Province, China. Scientific Reports, 11: 1280, doi: 10.1038/s41598-020-80527-3.
doi: 10.1038/s41598-020-80527-3
pmid: 33446853
|
|
|
| [28] |
Martinez-Villalobos C, Neelin J D. 2019. Why do precipitation intensities tend to follow gamma distributions? Journal of the Atmospheric Sciences, 76(11): 3611-3631.
doi: 10.1175/JAS-D-18-0343.1
|
|
|
| [29] |
McKee T B, Doesken N J, Kleist J. 1993. The relationship of drought frequency and duration to time scales. In:Proceedings of the 8th Conference on Applied Climatology. Boston, USA.
|
|
|
| [30] |
Nasrollahi M, Khosravi H, Moghaddamnia A, et al. 2018. Assessment of drought risk index using drought hazard and vulnerability indices. Arabian Journal of Geosciences, 11: 606, doi: 10.1007/s12517-018-3971-y.
doi: 10.1007/s12517-018-3971-y
|
|
|
| [31] |
Nejadrekabi M, Eslamian S, Zareian M J. 2022. Spatial statistics techniques for SPEI and NDVI drought indices: A case study of Khuzestan Province. International Journal of Environmental Science and Technology, 19: 6573-6594.
doi: 10.1007/s13762-021-03852-8
|
|
|
| [32] |
Neto A K, Ribeiro R B, Pruski F F. 2022. Assessment water balance through different sources of precipitation and actual evapotranspiration. [2022-09-08]. https://doi.org/10.21203/rs.3.rs-1443692/v1.
doi: https://doi.org/10.21203/rs.3.rs-1443692/v1
|
|
|
| [33] |
Palmer W C. 1965. Meteorological Drought. Washington: Office of Climatology, US Weather Bureau, 7-12.
|
|
|
| [34] |
Peel M C, Finlayson B L, McMahon T A. 2007. Updated world map of the Köppen-Geiger climate classification. Hydrology and Earth System Sciences, 11(5): 1633-1644.
doi: 10.5194/hess-11-1633-2007
|
|
|
| [35] |
Pei Z F, Fang S B, Wang L, et al. 2020. Comparative analysis of drought indicated by the SPI and SPEI at various timescales in Inner Mongolia, China. Water, 12(7): 1925, doi: 10.3390/w12071925.
doi: 10.3390/w12071925
|
|
|
| [36] |
Rahimi J, Laux P, Khalili A. 2020. Assessment of climate change over Iran: CMIP 5 results and their presentation in terms of Köppen-Geiger climate zones. Theoretical and Applied Climatology, 141(1): 183-199.
doi: 10.1007/s00704-020-03190-8
|
|
|
| [37] |
Salvacion A R. 2022. Multiscale drought hazard assessment in the Philippines. Computers in Earth and Environmental Sciences, doi: 10.1016/B978-0-323-89861-4.00024-5.
doi: 10.1016/B978-0-323-89861-4.00024-5
|
|
|
| [38] |
Sharafati A, Nabaei S, Shahid S. 2020. Spatial assessment of meteorological drought features over different climate regions in Iran. International Journal of Climatology, 40(3): 1864-1884.
doi: 10.1002/joc.6307
|
|
|
| [39] |
Sönmez F K, Koemuescue A U, Erkan A, et al. 2005. An analysis of spatial and temporal dimension of drought vulnerability in Turkey using the standardized precipitation index. Natural Hazards, 35(2): 243-264.
doi: 10.1007/s11069-004-5704-7
|
|
|
| [40] |
Tall A. 2008. Application of the palmer drought severity index in east Slovakian lowland. Cereal Research Communications, 36: 1195-1198.
|
|
|
| [41] |
Tan C P, Yang J P, Li M. 2015. Temporal-spatial variation of drought indicated by SPI and SPEI in Ningxia Hui Autonomous Region, China. Atmosphere, 6(10): 1399-1421.
doi: 10.3390/atmos6101399
|
|
|
| [42] |
Tao R, Zhang K, 2020. PDSI-based analysis of characteristics and spatiotemporal changes of meteorological drought in China from 1982 to 2015. Water Resources Protection, 36(5): 50-56. (in Chinese with English abstract)
|
|
|
| [43] |
Tatli H, Türkeş M. 2011. Empirical orthogonal function analysis of the Palmer drought indices. Agricultural and Forest Meteorology, 151(7): 981-991.
doi: 10.1016/j.agrformet.2011.03.004
|
|
|
| [44] |
Tefera A S, Ayoade J O, Bello N J. 2019. Comparative analyses of SPI and SPEI as drought assessment tools in Tigray Region, Northern Ethiopia. SN Applied Sciences, 1: 1265, doi: 10.1007/s42452-019-1326-2.
doi: 10.1007/s42452-019-1326-2
|
|
|
| [45] |
Vicente-Serrano S M, Beguería S, López-Moreno J I. 2010. A multiscalar drought index sensitive to global warming: the standardized precipitation evapotranspiration index. Journal of Climate, 23(7): 1696-1718.
doi: 10.1175/2009JCLI2909.1
|
|
|
| [46] |
Wang H J, Chen Y N, Pan Y P, et al. 2019. Assessment of candidate distributions for SPI/SPEI and sensitivity of drought to climatic variables in China. International Journal of Climatology, 39(11): 4392-4412.
doi: 10.1002/joc.6081
|
|
|
| [47] |
World Meteorological Organization. 2012. Standardized precipitation index user guide. In: Svoboda M, Hayes M, Wood D. World Meteorological Organization No. 1090. Geneva: World Meteorological Organization.
|
|
|
| [48] |
Yang P, Xia J, Zhang Y Y, et al. 2018. Comprehensive assessment of drought risk in the arid region of Northwest China based on the global palmer drought severity index gridded data. Science of the Total Environment, 627: 951-962.
doi: 10.1016/j.scitotenv.2018.01.234
|
|
|
| [49] |
Zarei A, Asadi E, Ebrahimi A, et al. 2017. Comparison of meteorological indices for spatio-temporal analysis of drought in Chahrmahal-Bakhtiyari province in Iran. Croatian Meteorological Journal, 52: 13-26.
|
|
|
| [50] |
Zarei A R, Shabani A, Moghimi M M. 2021. Accuracy assessment of the SPEI, RDI and SPI drought indices in regions of Iran with different climate conditions. Pure and Applied Geophysics, 178(4): 1387-1403.
doi: 10.1007/s00024-021-02704-3
|
|
|
| [51] |
Zhang J, Sun F B, Lai W L, et al. 2019. Attributing changes in future extreme droughts based on PDSI in China. Journal of Hydrology, 573: 607-615.
doi: 10.1016/j.jhydrol.2019.03.060
|
|
|
| [52] |
Zhang Y J, Yu Z S, Niu H S. 2018. Standardized Precipitation Evapotranspiration Index is highly correlated with total water storage over China under future climate scenarios. Atmospheric Environment, 194: 123-133.
doi: 10.1016/j.atmosenv.2018.09.028
|
|
|
| [53] |
Zhou Y L, Zhou P, Jin J L, et al. 2022. Drought identification based on Palmer drought severity index and return period analysis of drought characteristics in Huaibei Plain China. Environmental Research, 212: 113163, doi: 10.1016/j.envres.2022.113163.
doi: 10.1016/j.envres.2022.113163
|
|
|
| [54] |
Zoljoodi M, Didevarasl A. 2013. Evaluation of spatial-temporal variability of drought events in Iran using palmer drought severity index and its principal factors (through 1951-2005). Atmospheric and Climate Sciences, 3(2): 193-207.
doi: 10.4236/acs.2013.32021
|
|
|
|
Viewed |
|
|
|
Full text
|
|
|
|
|
Abstract
|
|
|
|
|
Cited |
|
|
|
|
| |
Shared |
|
|
|
|
| |
Discussed |
|
|
|
|