Please wait a minute...
Journal of Arid Land  2022, Vol. 14 Issue (11): 1234-1257    DOI: 10.1007/s40333-022-0081-1
Research article     
Implications of future climate change on crop and irrigation water requirements in a semi-arid river basin using CMIP6 GCMs
Kunal KARAN1, Dharmaveer SINGH2,*(), Pushpendra K SINGH3,*(), Birendra BHARATI1, Tarun P SINGH2, Ronny BERNDTSSON4
1Department of Water Engineering and Management, Central University of Jharkhand, Brambe, Ranchi 835205, India
2Symbiosis Institute of Geo-informatics, Symbiosis International (Deemed University), Pune 411016, India
3Water Resources Systems Division, National Institute of Hydrology, Roorkee 247667, India
4Division of Water Resources Engineering & Centre for Advanced Middle Eastern Studies, Lund University, Lund Box 117, 22100, Sweden
Download: HTML     PDF(1744KB)
Export: BibTeX | EndNote (RIS)      

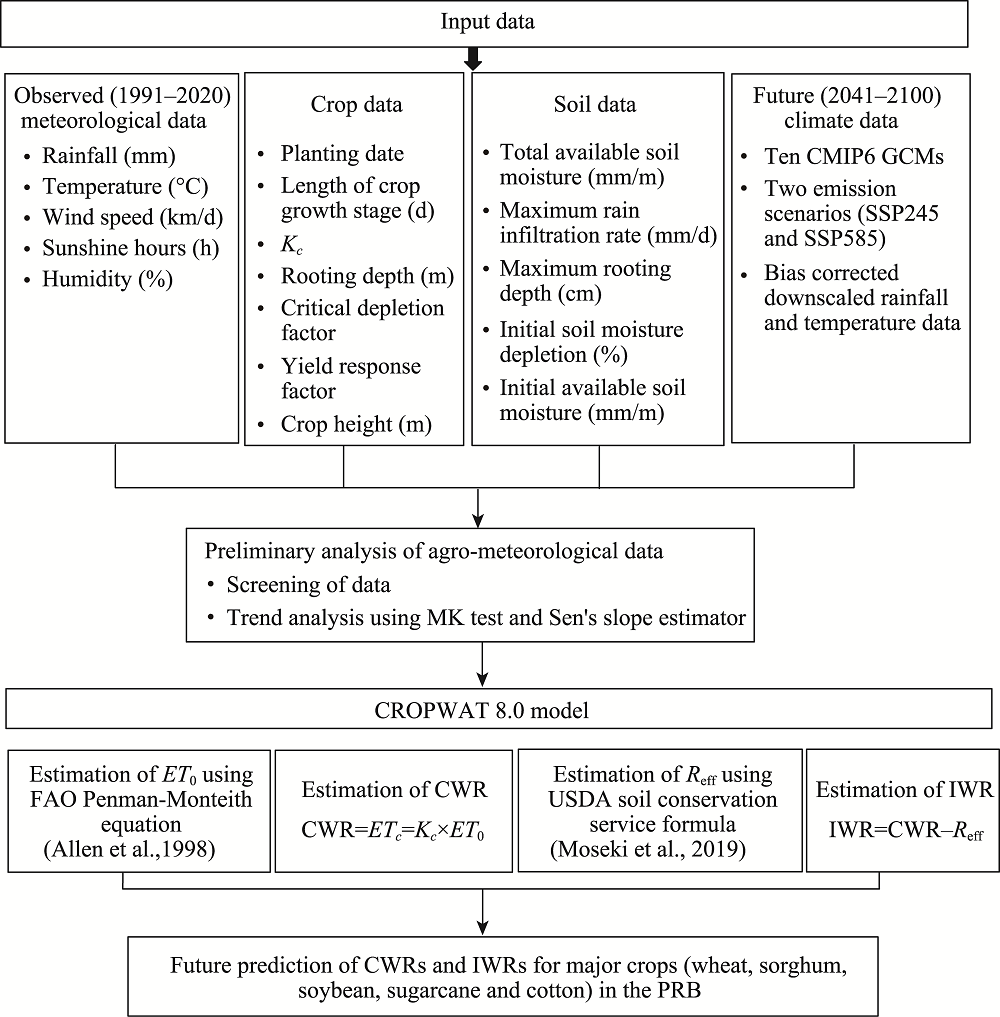
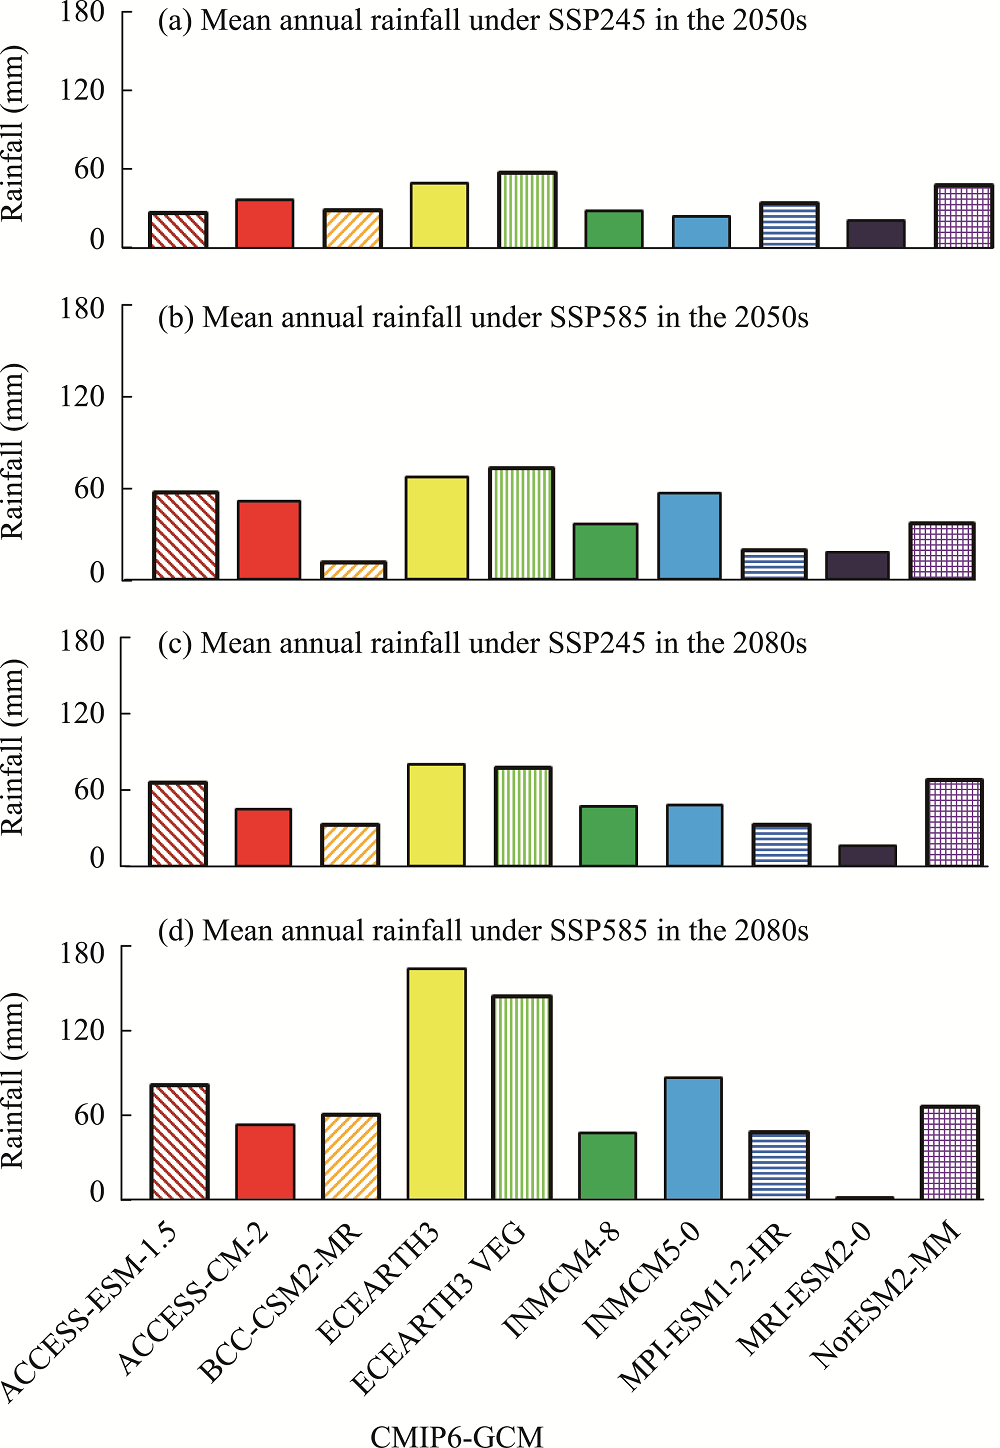
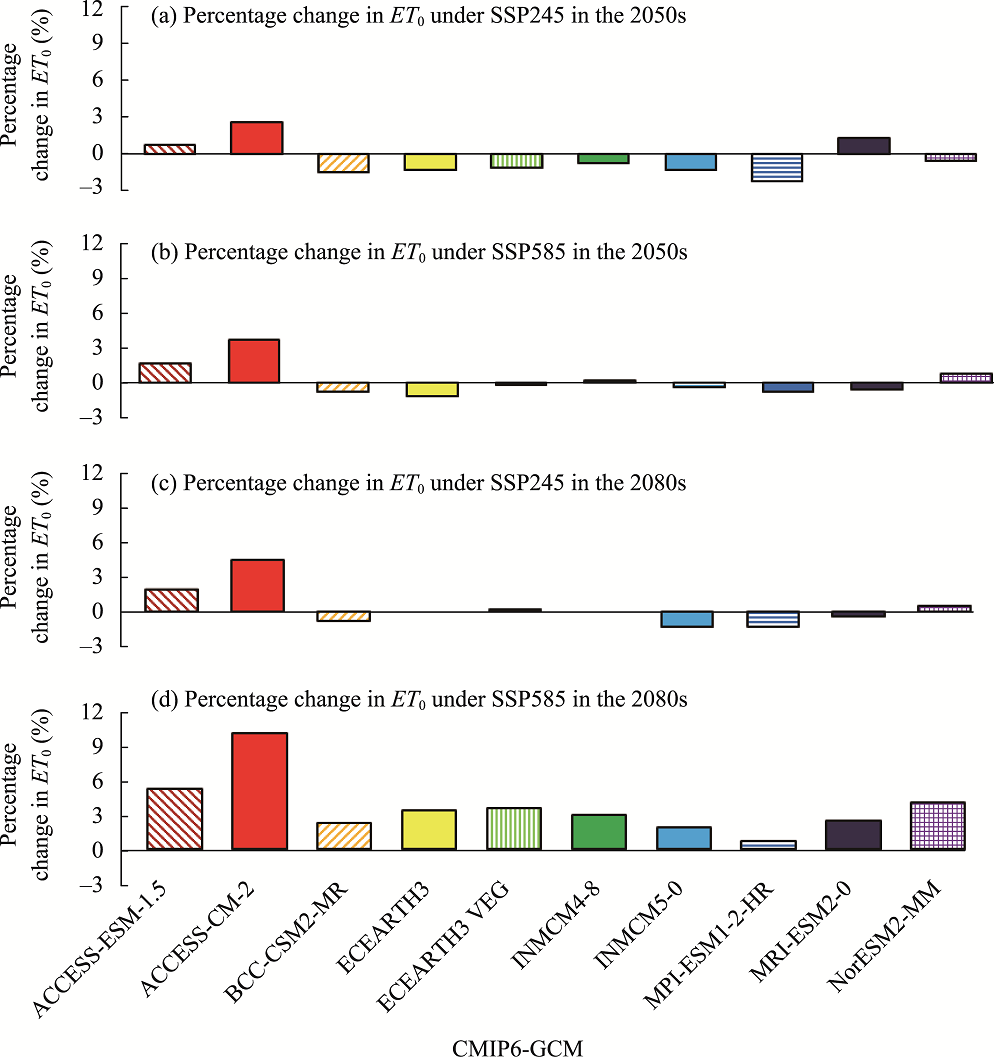
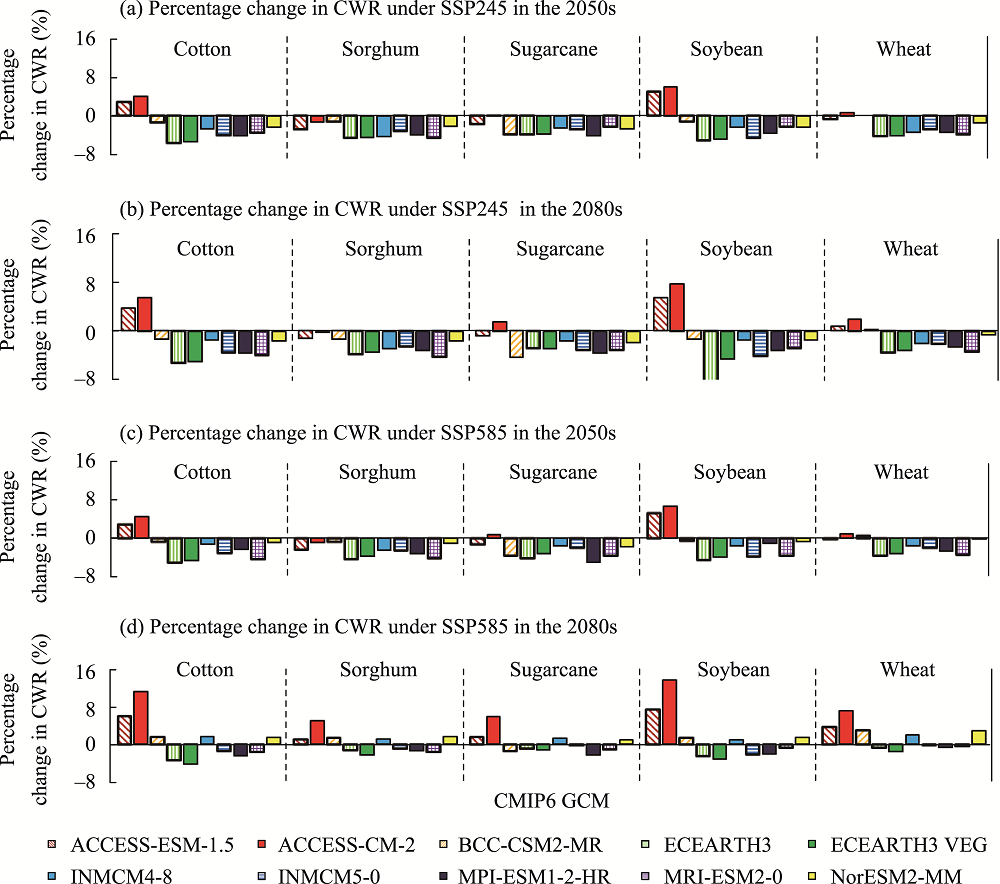
Abstract  

Agriculture faces risks due to increasing stress from climate change, particularly in semi-arid regions. Lack of understanding of crop water requirement (CWR) and irrigation water requirement (IWR) in a changing climate may result in crop failure and socioeconomic problems that can become detrimental to agriculture-based economies in emerging nations worldwide. Previous research in CWR and IWR has largely focused on large river basins and scenarios from the Coupled Model Intercomparison Project Phase 3 (CMIP3) and Coupled Model Intercomparison Project Phase 5 (CMIP5) to account for the impacts of climate change on crops. Smaller basins, however, are more susceptible to regional climate change, with more significant impacts on crops. This study estimates CWRs and IWRs for five crops (sugarcane, wheat, cotton, sorghum, and soybean) in the Pravara River Basin (area of 6537 km2) of India using outputs from the most recent Coupled Model Intercomparison Project Phase 6 (CMIP6) General Circulation Models (GCMs) under Shared Socio-economic Pathway (SSP)245 and SSP585 scenarios. An increase in mean annual rainfall is projected under both scenarios in the 2050s and 2080s using ten selected CMIP6 GCMs. CWRs for all crops may decline in almost all of the CMIP6 GCMs in the 2050s and 2080s (with the exceptions of ACCESS-CM-2 and ACCESS-ESM-1.5) under SSP245 and SSP585 scenarios. The availability of increasing soil moisture in the root zone due to increasing rainfall and a decrease in the projected maximum temperature may be responsible for this decline in CWR. Similarly, except for soybean and cotton, the projected IWRs for all other three crops under SSP245 and SSP585 scenarios show a decrease or a small increase in the 2050s and 2080s in most CMIP6 GCMs. These findings are important for agricultural researchers and water resource managers to implement long-term crop planning techniques and to reduce the negative impacts of climate change and associated rainfall variability to avert crop failure and agricultural losses.


Key wordsclimate change      crop water requirement      irrigation water requirement      CMIP6 GCMs      emission scenario      Pravara River Basin     
Received: 27 July 2022      Published: 30 November 2022
Corresponding Authors: *Dharmaveer SINGH (E-mail: veermnnit@gmail.com);Puspendra K SINGH (E-mail: pushpendras123@gmail.com)
Cite this article:

Kunal KARAN, Dharmaveer SINGH, Pushpendra K SINGH, Birendra BHARATI, Tarun P SINGH, Ronny BERNDTSSON. Implications of future climate change on crop and irrigation water requirements in a semi-arid river basin using CMIP6 GCMs. Journal of Arid Land, 2022, 14(11): 1234-1257.

URL:

http://jal.xjegi.com/10.1007/s40333-022-0081-1     OR     http://jal.xjegi.com/Y2022/V14/I11/1234

Fig. 1 Overview of the Pravara River Basin (PRB) as well as the important places (cities, towns, and dams) in the basin
Crop Scientific name Planting-
harvesting date
Critical
depletion
factor
Rooting
depth (cm)
Length of crop growth stage (d)
Initial Developing Middle
season
Late season
Wheat Triticum aestivum 15 Oct-11 Feb 0.55 1.50 15 25 50 30
Sorghum Sorghum bicolor 15 Oct-16 Feb 0.60 1.40 20 35 40 30
Sugarcane Saccharum officinarum 15 July-14 July 0.65 1.50 30 60 180 95
Cotton Gossypium 15 July-10 Jan 0.65 1.40 30 50 55 45
Soybean Glycine max 15 July-1 Dec 0.50 1.00 30 30 50 30
Table 1 Planting and harvesting date for the major crops grown in the Pravara River Basin (PRB)
Fig. 2 Flowchart showing the adopted methodology for estimating and investigating the implications of future climate change on CWRs and IWRs for major crops in the PRB. CWR, crop water requirement; IWR, irrigation water requirements; Kc, crop coefficient; CMIP6, Coupled Model Intercomparison Project Phase 6; GCMs, General Circulation Models; SSP, Shared Socio-economic Pathway; MK, Mann-Kendall; ET0, reference crop evapotranspiration; FAO, Food and Agriculture Organization; ETc, crop evapotranspiration; Reff, effective rainfall.
CMIP6 GCM Description Spatial resolution Institution
ACCESS-ESM-1.5 Australian Community Climate and Earth System Simulator-Earth System Model Version 1.0 1.250°×1.875° Commonwealth Scientific and Industrial Organisation (CSIRO), Australia and Bureau of Meteorology (BOM), Australia
ACCESS-CM-2 Australian Community Climate and Earth System Simulator-Coupled Model Version 2.0 1.250°×1.875° Commonwealth Scientific and Industrial Organisation (CSIRO), Australia and Bureau of Meteorology (BOM), Australia
BCC-CSM2-MR Beijing Climate Centre Climate System Model Version 2.0 1.100°×1.100° Beijing Climate Centre, China Meteorological Administration, China
EC-Earth3 Earth Consortium-Earth 3 Model 0.350°×0.350° Twenty-seven research institutes from 10 European countries
EC-Earth3-Veg Earth Consortium-Earth 3 Veg Model 0.350°×0.350° Twenty-seven research institutes from 10 European countries
INM-CM4-8 Institute for Numerical Mathematics Climate Model Version 4.8 2.000°×1.500° Institute for Numerical Mathematics, Russia
INM-CM5-0 Institute for Numerical Mathematics Climate Model Version 5.0 2.000°×1.500° Institute for Numerical Mathematics, Russia
MPI-ESM1-2-HR Max Planck Institute for Meteorology Earth System Model Version 1.2 with higher resolution 0.940°×0.940° Max Planck Institute for Meteorology, Germany
MRI-ESM2.0 Meteorological Research Institute Earth System Model Version 2.0 1.125°×1.125° Meteorological Research Institute, Japan
NorESM2-MM Norwegian Earth System Model Version 2.0 with medium resolution 2.500°×1.890° Norwegian Community Earth System Model, Norway
Table 2 Detailed description of Coupled Model Intercomparison Project Phase 6 (GMIP6) General Circulation Models (GCMs) used in this study
Climatic variable Mean Standard deviation Coefficient of skewness Coefficient of kurtosis Coefficient of variance (%) Buishand's Range test
Cumulative deviation/square root (n) R/square root (n) Break year
Annual
Tmax (°C) 33.72 0.50 -0.27 0.26 1.50 1.38 1.99* 2016
Tmin (°C) 18.99 0.26 0.04 -0.07 1.40 0.54 0.87
Rainfall (mm) 593.38 176.10 1.17 1.58 29.68 0.75 0.75
Pre-monsoon season (March-May)
Tmax (°C) 38.99 0.54 0.01 0.46 1.40 1.06 1.50
Tmin (°C) 21.07 0.56 -0.37 0.34 2.68 0.58 1.03
Rainfall (mm) 18.03 22.34 1.88 3.92 123.87 1.09 1.16
Monsoon season (June-September)
Tmax (°C) 31.93 0.69 -0.22 -0.79 2.18 1.37 1.51* 2016
Tmin (°C) 23.57 0.70 -1.04 0.51 2.99 1.66 1.70* 2016
Rainfall (mm) 470.25 150.39 1.40 2.57 31.98 1.65 1.65* 2017
Post-monsoon season (October-November)
Tmax (°C) 32.68 0.88 -0.52 0.63 2.71 1.03 1.53* 2016
Tmin (°C) 17.77 0.67 -0.08 0.25 3.78 0.89 1.12
Rainfall (mm) 98.17 75.02 0.94 0.35 76.43 0.89 0.98
Winter season (December-February)
Tmax (°C) 31.49 0.67 -0.01 -0.28 2.13 1.04 1.87* 2019
Tmin (°C) 11.51 0.93 1.42 1.70 8.11 1.56 1.60* 2017
Rainfall (mm) 6.91 16.81 3.49 13.02 243.05 1.07 1.23
Table 3 Statistical information of annual and seasonal climatic variables averaged over 1991-2020 in the PRB
Period Tmax Tmin Rainfall
Zs Q (°C/a) Zs Q (°C/a) Zs Q (°C/a)
Annual -0.71 -0.01 -0.14 No trend -1.32 -4.61
Monsoon 0.96 0.02 0.96 0.02 -1.21 -3.78
Pre-monsoon -0.82 -0.01 0.18 No trend -0.04 No trend
Winter -0.71 -0.01 -1.25 -0.02 0.13 No trend
Post-monsoon -0.71 -0.02 0.86 0.01 -0.25 -0.62
Table 4 Annual and seasonal trends in temperature and rainfall anomalies in the PRB for historical period (1991-2020)
Fig. 3 Projected changes in annual Tmin (a-d) and Tmax (e-h) in the PRB using different CMIP6 GCMs under SSP245 and SSP585 scenarios in the 2050s and 2080s. Tmin, minimum temperature; Tmax, maximum temperature.
Fig. 4 Projected changes in mean annual rainfall in the PRB using different CMIP6 GCMs under SSP245 and SSP585 scenarios in the 2050s (a and b) and 2080s (c and d).
Month Temperature (°C) Humidity
(%)
Wind speed
(km/d)
Sunshine
hours (h)
Rn (MJ
/(m2•d))
ET0
(mm/d)
Rainfall
(mm/month)
Reff
(mm/month)
Tmin Tmax
Jan 10.41 30.81 36 182 5.21 13.41 4.44 1.01 1.02
Feb 13.12 33.52 27 203 5.52 15.22 5.54 1.41 1.42
Mar 17.41 37.01 26 233 5.42 16.73 6.80 6.42 6.34
Apr 21.7 39.62 24 291 5.34 17.64 7.92 2.81 2.82
May 24.14 40.42 53 311 5.01 17.44 7.29 8.91 8.82
Jun 24.63 35.12 72 319 5.12 17.52 5.52 115.82 94.34
Jul 23.54 31.01 82 292 5.01 17.35 4.31 98.01 82.62
Aug 23.42 30.21 84 236 5.32 17.52 4.02 107.72 89.13
Sep 22.82 31.62 70 187 5.34 16.81 4.40 148.71 113.34
Oct 20.23 33.42 58 174 5.54 15.62 4.61 77.01 67.56
Nov 15.32 31.92 50 174 5.42 13.91 4.33 21.22 20.51
Dec 11.21 30.41 44 176 5.23 12.82 4.11 4.51 4.53
Average 18.99 33.73 53 232 5.31 16.01 5.27 593.42 492.21
Table 5 Estimations of monthly reference crop evapotranspiration (ET0) and effective rainfall (Reff) in the PRB from meteorological data averaged over 1991-2020
Month Number of cycles
per 10 d
Growth
stage
Kc CWR Reff
(mm/10 d)
IWR
(mm/10 d)
(mm/d) (mm/10 d)
Oct 2 Initial 0.75 3.44 20.61 13.50 9.40
Oct 3 Developing 0.75 3.39 37.30 17.30 20.10
Nov 1 Developing 0.88 3.89 38.90 11.10 27.80
Nov 2 Developing 1.06 4.57 45.70 5.40 40.30
Nov 3 Middle 1.19 5.04 50.41 4.10 46.30
Dec 1 Middle 1.19 4.97 49.71 2.90 46.80
Dec 2 Middle 1.19 4.89 48.90 0.90 47.90
Dec 3 Middle 1.19 5.02 55.20 0.70 54.50
Jan 1 Middle 1.19 5.15 51.50 0.60 50.90
Jan 2 Late 1.15 5.10 51.00 0.20 50.80
Jan 3 Late 1.03 4.96 54.60 0.30 54.30
Feb 1 Late 0.91 4.72 47.21 0.30 47.00
Feb 2 Late 0.85 4.72 4.70 0.00 4.70
Average 555.84 57.30 500.80
Table 6 Estimations of CWR and IWR for wheat in the PRB for historical period (1991-2020)
Month Number of cycles
per 10 d
Growth
stage
Kc CWR Reff
(mm/10 d)
IWR
(mm/10 d)
(mm/d) (mm/10 d)
Oct 2 Initial 0.30 1.38 8.30 13.50 0.00
Oct 3 Initial 0.30 1.35 14.80 17.30 0.00
Nov 1 Developing 0.36 1.59 15.90 11.10 4.80
Nov 2 Developing 0.57 2.45 24.50 5.40 19.20
Nov 3 Developing 0.78 3.32 33.20 4.10 29.20
Dec 1 Middle 0.99 4.14 41.40 2.90 38.50
Dec 2 Middle 1.05 4.31 43.10 0.90 42.20
Dec 3 Middle 1.05 4.43 48.70 0.70 48.00
Jan 1 Middle 1.05 4.55 45.50 0.60 44.80
Jan 2 Late 1.04 4.62 46.20 0.20 46.00
Jan 3 Late 0.92 4.41 48.50 0.30 48.30
Feb 1 Late 0.76 3.95 39.50 0.30 39.20
Feb 2 Late 0.65 3.58 21.50 0.20 21.30
Average 431.20 57.40 381.50
Table 7 Estimations of CWR and IWR for sorghum in the PRB for historical period (1991-2020)
Month Number of cycles
per 10 d
Growth
stage
Kc CWR Reff
(mm/10 d)
IWR
(mm/10 d)
(mm/d) (mm/10 d)
Jul 2 Initial 0.40 1.67 10.00 16.00 0.00
Jul 3 Initial 0.40 1.65 18.10 27.70 0.00
Aug 1 Initial 0.40 1.64 16.40 28.50 0.00
Aug 2 Developing 0.47 1.88 18.80 28.90 0.00
Aug 3 Developing 0.72 2.97 32.70 31.90 0.80
Sep 1 Developing 0.98 4.16 41.60 37.30 4.30
Sep 2 Middle 1.13 4.97 49.70 41.10 8.60
Sep 3 Middle 1.14 5.06 50.60 34.90 15.70
Oct 1 Middle 1.14 5.14 51.40 27.60 23.80
Oct 2 Middle 1.14 5.22 52.20 22.50 29.70
Oct 3 Middle 1.14 5.12 56.30 17.30 39.00
Nov 1 Late 1.05 4.60 46.00 11.10 35.00
Nov 2 Late 0.84 3.62 36.20 5.40 30.90
Nov 3 Late 0.63 2.69 26.90 4.10 22.80
Dec 1 Late 0.52 2.17 2.20 0.30 2.20
Average 509.10 334.40 212.80
Table 8 Estimations of CWR and IWR for soybean in the PRB for historical period (1991-2020)
Month Number of cycles
per 10 d
Growth
stage
Kc CWR Reff
(mm/10 d)
IWR
(mm/10 d)
(mm/d) (mm/10 d)
Jul 2 Initial 0.81 3.39 20.40 16.00 0.20
Jul 3 Initial 0.40 1.65 18.10 27.70 0.00
Aug 1 Initial 0.40 1.64 16.40 28.50 0.00
Aug 2 Developing 0.44 1.77 17.70 28.90 0.00
Aug 3 Developing 0.60 2.46 27.10 31.90 0.00
Sep 1 Developing 0.76 3.22 32.20 37.30 0.00
Sep 2 Developing 0.91 3.97 39.70 41.10 0.00
Sep 3 Developing 1.06 4.71 47.10 34.90 12.20
Oct 1 Developing 1.21 5.47 54.70 27.60 27.10
Oct 2 Middle 1.31 6.00 60.00 22.50 37.50
Oct 3 Middle 1.31 5.88 64.70 17.30 47.50
Nov 1 Middle 1.31 5.77 57.70 11.10 46.60
Nov 2 Middle 1.31 5.65 56.50 5.40 51.10
Nov 3 Middle 1.31 5.55 55.50 4.10 51.50
Dec 1 Middle 1.31 5.46 54.60 2.90 51.70
Dec 2 Middle 1.31 5.37 53.70 0.90 52.70
Dec 3 Middle 1.31 5.51 60.60 0.70 59.90
Jan 1 Middle 1.31 5.66 56.60 0.60 55.90
Jan 2 Middle 1.31 5.80 58.00 0.20 57.80
Jan 3 Middle 1.31 6.28 69.10 0.30 68.80
Feb 1 Middle 1.31 6.76 67.60 0.30 67.30
Month Number of cycles
per 10 d
Growth
stage
Kc CWR Reff
(mm/10 d)
IWR
(mm/10 d)
(mm/d) (mm/10 d)
Feb 2 Middle 1.31 7.24 72.40 0.30 72.10
Feb 3 Middle 1.31 7.79 62.30 0.90 61.40
Mar 1 Middle 1.31 8.34 83.40 1.80 81.60
Mar 2 Middle 1.31 8.89 88.90 2.50 86.40
Mar 3 Middle 1.31 9.38 103.20 2.00 101.20
Apr 1 Middle 1.31 10.05 100.50 1.10 99.40
Apr 2 Late 1.28 10.39 103.90 0.50 103.40
Apr 3 Late 1.23 9.62 96.20 1.30 94.90
May 1 Late 1.17 8.88 88.80 0.30 88.50
May 2 Late 1.12 8.28 82.80 0.00 82.80
May 3 Late 1.06 7.20 79.20 8.60 70.60
Jun 1 Late 1.01 6.15 61.50 25.00 36.50
Jun 2 Late 0.95 5.26 52.60 36.00 16.50
Jun 3 Late 0.90 4.60 46.00 33.20 12.70
Jul 1 Late 0.85 3.92 39.20 28.30 10.90
Jul 2 Late 0.81 3.39 13.60 10.70 0.20
Average 2162.10 492.40 1707.00
Table 9 Estimations of CWR and IWR for sugarcane in the PRB for historical period (1991-2020)
Month Number of cycles
per 10 d
Growth
stage
Kc CWR Reff
(mm/10 d)
IWR
(mm/10 d)
(mm/d) (mm/10 d)
Jul 2 Initial 0.35 1.46 8.80 16.00 0.00
Jul 3 Initial 0.35 1.44 15.90 27.70 0.00
Aug 1 Initial 0.35 1.43 14.30 28.50 0.00
Aug 2 Developing 0.40 1.59 15.90 28.90 0.00
Aug 3 Developing 0.57 2.37 26.00 31.90 0.00
Sep 1 Developing 0.75 3.21 32.10 37.30 0.00
Sep 2 Developing 0.93 4.06 40.60 41.10 0.00
Sep 3 Developing 1.10 4.89 48.90 34.90 14.00
Oct 1 Middle 1.21 5.46 54.60 27.60 27.00
Oct 2 Middle 1.21 5.56 55.60 22.50 33.00
Oct 3 Middle 1.21 5.45 59.90 17.30 42.60
Nov 1 Middle 1.21 5.34 53.40 11.10 42.30
Nov 2 Middle 1.21 5.23 52.30 5.40 46.90
Nov 3 Late 1.20 5.09 50.90 4.10 46.80
Dec 1 Late 1.09 4.55 45.50 2.90 42.60
Dec 2 Late 0.97 3.96 39.60 0.90 38.70
Dec 3 Late 0.83 3.51 38.70 0.70 37.90
Jan 1 Late 0.70 3.04 30.40 0.60 29.70
Average 683.30 339.30 401.60
Table 10 Estimations of CWR and IWRs for cotton in the PRB for historical period (1991-2020)
Month ET0 (mm/d)
ACCESS-
ESM-1.5
ACCESS-
CM-2
BCC-
CSM
2-MR
EC-
EARTH3
EC-
EARTH
3 VEG
INMCM4
-8
INMCM5
-0
MPI-
ESM1-
2-HR
MRI-
ESM2-0
NorESM2
-MM
Baseline period
SSP245 scenario
Jan 4.40 4.47 4.49 4.42 4.44 4.43 4.42 4.41 4.40 4.44 4.44
Feb 5.42 5.56 5.47 5.45 5.51 5.55 5.62 5.39 5.39 5.46 5.54
Mar 6.69 6.86 6.67 6.73 6.72 6.95 6.92 6.59 6.69 6.83 6.80
Apr 7.85 7.89 7.78 7.86 7.81 7.87 7.92 7.72 7.75 7.89 7.92
May 7.16 7.14 7.07 7.11 7.09 6.96 6.90 7.06 7.09 7.08 7.29
Jun 5.62 5.87 5.16 5.71 5.76 5.56 5.50 5.57 5.82 5.56 5.52
Jul 4.25 4.63 4.02 4.23 4.27 4.21 4.21 4.12 6.02 4.21 4.31
Aug 3.94 4.11 3.86 3.94 3.96 4.02 3.94 3.89 3.83 3.95 4.02
Sept 4.58 4.56 4.22 4.23 4.25 4.31 4.20 4.27 4.23 4.22 4.40
Oct 5.00 4.95 4.69 4.36 4.38 4.43 4.37 4.43 4.42 4.53 4.61
Nov 4.55 4.62 4.53 4.13 4.14 4.25 4.20 4.21 4.20 4.38 4.33
Dec 4.18 4.19 4.25 4.03 4.03 4.03 4.07 4.03 4.07 4.14 4.11
Average 5.30 5.40 5.18 5.19 5.20 5.22 5.19 5.14 5.33 5.23 5.27
SSP585 scenario
Jan 4.46 4.50 4.52 4.45 4.47 4.48 4.46 4.42 4.47 4.50 4.46
Feb 5.49 5.61 5.44 5.53 5.57 5.58 5.68 5.43 5.49 5.55 5.49
Mar 6.73 6.89 6.77 6.80 6.83 6.93 7.02 6.77 6.75 6.90 6.73
Apr 7.93 7.97 7.90 7.98 7.92 7.96 7.94 6.56 7.82 7.96 7.93
May 7.14 7.21 7.02 6.74 7.14 7.01 6.97 7.02 7.09 7.16 7.14
Jun 5.75 5.97 5.19 5.69 5.77 5.64 5.61 5.53 5.86 5.67 5.75
Jul 4.31 4.71 4.06 4.26 4.26 4.28 4.20 5.86 4.34 4.28 4.31
Aug 3.96 4.19 3.89 3.99 4.01 4.05 3.97 3.93 3.88 3.99 3.96
Sept 4.59 4.61 4.25 4.28 4.28 4.35 4.23 4.28 4.27 4.29 4.59
Oct 5.01 5.02 4.74 4.42 4.45 4.47 4.41 4.45 4.46 4.60 5.01
Nov 4.59 4.58 4.58 4.21 4.21 4.31 4.28 4.29 4.24 4.47 4.59
Dec 4.20 4.23 4.29 4.07 4.09 4.15 4.11 4.08 4.08 4.24 4.20
Average 5.35 5.46 5.22 5.20 5.25 5.27 5.24 5.22 5.23 5.30 5.35
Table 11 Projected estimations of monthly ET0 using different CMIP6 GCMs in the PRB under SSP245 and SSP585 scenarios in the 2050s
Month ET0 (mm/d)
ACCESS-
ESM-1.5
ACCESS-
CM-2
BCC-
CSM2-
MR
EC-
EARTH3
EC-
EARTH3 VEG
INMCM4-8 INMCM5-0 MPI-
ESM1-
2-HR
MRI-
ESM2-0
NorESM2-MM Baseline period
SSP245 scenario
Jan 4.47 4.55 4.47 4.48 4.53 4.45 4.50 4.44 4.44 4.46 4.44
Feb 5.51 5.64 5.47 5.62 5.67 5.57 5.60 5.44 5.46 5.57 5.54
Mar 6.75 6.91 6.77 6.9 6.87 6.94 7.01 6.68 6.74 6.88 6.80
Apr 7.88 8.01 7.91 7.98 7.95 8.00 7.59 7.84 7.81 7.93 7.92
May 7.19 7.27 7.07 7.17 7.18 7.02 6.94 7.15 7.11 7.18 7.29
Jun 5.77 6.01 5.21 5.81 5.77 5.65 5.58 5.58 5.93 5.74 5.52
Jul 4.34 4.74 4.07 4.29 4.32 4.24 4.20 4.16 4.40 4.28 4.31
Aug 3.95 4.26 3.89 4.01 3.99 4.04 3.96 3.92 3.90 3.98 4.02
Sept 4.58 4.62 4.21 4.28 4.29 4.33 4.22 4.27 4.32 4.27 4.40
Oct 5.03 5.02 4.74 4.38 4.38 4.47 4.39 4.46 4.51 4.55 4.61
Nov 4.61 4.66 4.59 4.17 4.16 4.29 4.22 4.28 4.22 4.44 4.33
Dec 4.27 4.27 4.26 4.06 4.08 4.12 4.09 4.08 4.06 4.22 4.11
Average 5.36 5.5 5.22 5.26 5.27 5.26 5.19 5.19 5.24 5.29 5.27
SSP585 scenario
Jan 4.63 4.82 4.69 4.65 4.72 4.65 4.61 4.59 4.65 4.69 4.63
Feb 5.68 6.02 5.74 5.91 5.94 5.83 5.77 5.62 5.72 5.83 5.68
Mar 7.06 7.25 6.98 7.17 7.21 7.19 7.15 6.85 7.02 7.14 7.06
Apr 8.23 8.33 8.08 8.21 8.20 8.17 8.15 7.97 8.05 8.19 8.23
May 7.37 7.52 7.23 7.36 7.35 7.16 7.14 7.27 7.29 7.35 7.37
Jun 5.91 6.26 5.37 6.01 5.99 5.79 5.76 5.59 5.97 5.91 5.91
Jul 4.42 5.03 4.13 4.44 4.44 4.38 4.39 4.23 4.42 4.45 4.42
Aug 4.04 4.55 3.96 4.09 4.11 4.12 4.03 4.02 3.95 4.08 4.04
Sept 4.64 4.98 4.34 4.39 4.40 4.42 4.29 4.33 4.36 4.38 4.64
Oct 5.13 5.27 4.86 4.50 4.50 4.61 4.51 4.50 4.64 4.68 5.13
Nov 4.86 4.97 4.71 4.30 4.34 4.51 4.39 4.37 4.40 4.64 4.86
Dec 4.46 4.55 4.44 4.21 4.23 4.27 4.17 4.22 4.27 4.39 4.46
Average 5.54 5.80 5.38 5.44 5.45 5.42 5.36 5.30 5.39 5.48 5.54
Table 12 Projected estimations of monthly ET0 using different CMIP6 GCMs in the PRB under SSP245 and SSP585 scenarios in the 2080s
Fig. 5 Projected percentage change in ET0 using different CMIP6 GCMs in n the PRB under SSP245 (a and b) and SSP585 (c and d) scenarios in the 2050s and 2080s
CMIP6 GCM Scenario Average CWR (mm)
2050s 2080s
Cotton Sorghum Sugarcane Soybean Wheat Cotton Sorghum Sugarcane Soybean Wheat
ACCESS-ESM-1.5 SSP245 702.80 419.30 2123.20 534.30 551.90 708.30 425.50 2144.90 536.60 559.90
SSP585 703.30 421.10 2133.40 535.30 554.80 726.50 435.90 2199.20 547.90 576.80
ACCESS-CM-2 SSP245 710.80 426.00 2166.70 539.70 559.80 720.70 430.60 2193.50 548.40 566.10
SSP585 713.00 426.70 2177.80 542.70 560.80 761.80 453.10 2295.30 581.10 596.90
BCC-CSM2-MR SSP245 673.60 426.10 2076.50 502.80 555.80 674.20 425.10 2069.00 501.80 556.10
SSP585 678.90 427.80 2086.60 506.40 559.10 694.40 437.70 2131.70 517.00 573.50
EC-EARTH3 SSP245 644.60 411.40 2079.50 482.60 531.90 647.00 414.60 2099.20 458.30 536.10
SSP585 649.00 412.80 2073.50 486.80 535.50 659.10 425.80 2144.40 496.10 552.30
EC-EARTH3 VEG SSP245 646.30 411.70 2080.70 484.80 532.70 648.90 416.20 2099.20 485.90 538.30
SSP585 650.60 414.90 2093.10 488.50 537.70 654.20 420.80 2133.40 492.60 546.70
INMCM4-8 SSP245 664.70 412.60 2106.50 496.90 536.80 673.00 418.60 2128.00 501.50 544.10
SSP585 673.80 420.20 2126.50 500.70 546.80 695.20 436.40 2191.10 513.60 567.30
INMCM5-0 SSP245 655.20 417.30 2102.50 485.40 540.20 658.30 419.90 2093.30 487.70 543.40
SSP585 662.60 420.70 2119.30 490.20 545.30 673.50 427.60 2156.80 498.20 555.30
MPI-ESM1-2-HR SSP245 654.80 414.10 2070.90 490.50 536.40 658.50 417.70 2084.90 493.00 541.50
SSP585 667.50 417.20 2052.80 503.40 540.80 666.40 425.30 2109.80 498.50 552.30
MRI-ESM2-0 SSP245 659.00 411.40 2113.40 497.50 533.90 656.30 412.90 2092.40 494.50 536.90
SSP585 653.70 413.40 2086.20 490.90 537.40 672.30 424.30 2138.80 505.70 553.80
NorESM2-MM SSP245 666.90 421.60 2103.60 497.40 548.10 671.80 424.00 2120.00 501.30 552.20
SSP585 676.40 426.00 2123.20 505.00 555.10 693.60 438.30 2181.30 516.80 572.30
Table 13 Projected CWRs of five crops using different CMIP6 GCMs in the PRB under SSP245 and SSP585 scenarios in the 2050s and 2080s
Fig. 6 Projected percentage change in CWRs of five crops using different CMIP6 GCMs in the PRB under SSP245 (a and b) and SSP585 (c and d) scenarios in the 2050s and 2080s
CMIP6 GCM Scenario Average IWR (mm)
2050s 2080s
Cotton Sorghum Sugarcane Soybean Wheat Cotton Sorghum Sugarcane Soybean Wheat
ACCESS-ESM-1.5 SSP245 453.90 395.90 1755.20 319.60 430.20 443.50 311.90 1763.90 296.40 447.00
SSP585 397.30 259.00 1713.00 293.80 392.00 392.40 275.40 1720.90 270.10 418.30
ACCESS-CM-2 SSP245 416.30 286.20 1724.10 289.80 422.70 404.90 316.30 1724.00 243.00 451.00
SSP585 374.20 290.00 1683.10 218.30 409.70 350.90 266.00 1718.90 224.70 381.90
BCC-CSM2-MR SSP245 499.80 408.80 1732.50 317.20 538.70 452.50 402.00 1686.90 264.50 533.30
SSP585 495.80 411.20 1757.10 310.30 542.60 497.50 417.70 1759.10 302.20 553.80
ECEARTH3 SSP245 352.60 353.20 1680.90 172.90 468.20 348.80 354.60 1682.90 163.10 471.20
SSP585 346.90 356.30 1655.30 168.60 470.60 286.70 341.20 1659.00 113.10 438.60
ECEARTH3 VEG SSP245 360.10 350.10 1686.50 176.90 470.80 356.20 356.80 1680.90 173.00 475.70
SSP 585 365.60 355.20 1695.00 182.20 478.10 305.40 352.70 1665.60 117.50 453.30
INMCM4-8 SSP245 454.70 314.00 1808.30 322.00 438.20 475.30 329.90 1814.30 317.30 455.40
SSP585 472.70 349.40 1834.50 314.60 477.40 502.90 380.40 1884.30 329.50 511.30
INMCM5-0 SSP245 445.30 370.80 1812.80 277.00 493.80 428.10 373.30 1767.50 253.40 495.00
SSP585 431.80 376.10 1802.20 248.50 500.80 396.30 354.80 1770.90 219.50 473.10
MPI-ESM1-2-HR SSP245 389.20 378.10 1702.60 196.20 495.80 399.20 379.70 1666.90 205.10 504.50
SSP585 396.30 382.40 1642.30 202.20 503.20 364.20 396.60 1646.50 162.60 503.90
MRI-ESM2-0 SSP245 397.30 337.20 1739.20 238.90 458.80 364.20 310.40 1710.80 210.90 416.70
SSP585 371.90 344.10 1710.70 208.00 461.70 417.80 334.60 1774.40 248.70 463.30
NorESM2-MM SSP245 380.60 379.10 1664.60 185.30 493.80 380.40 371.10 1709.90 181.30 493.90
SSP585 389.30 371.50 1698.40 197.70 493.50 383.10 381.40 1733.70 178.10 505.20
Table 14 Projected IWRs of five crops using different CMIP6 GCMs in the PRB under SSS245 and SSP585 scenarios in the 2050s and 2080s
Fig. 7 Projected percentage change in IWRs using different CMIP6 GCMs in the PRB under SSP245 (a and b) and SSP585 (c and d) scenarios in the 2050s and 2080s
[1]   Abdoulaye A O, Lu H, Zhu Y et al. 2021. Future irrigation water requirements of the main crops cultivated in the Niger River Basin. Atmosphere, 12(4): 439, doi: 10.3390/atmos12040439.
doi: 10.3390/atmos12040439
[2]   Acharjee T K, Ludwig F, van Halsema G, et al. 2017. Future changes in water requirements of Boro rice in the face of climate change in North-West Bangladesh. Agricultural Water Management, 194: 172-183.
doi: 10.1016/j.agwat.2017.09.008
[3]   Ahmad M J, Cho G H, Kim S H, et al. 2021. Influence mechanism of climate change over crop growth and water demands for wheat-rice system of Punjab, Pakistan. Journal of Water and Climate Change, 12(4): 1184-1202.
doi: 10.2166/wcc.2020.009
[4]   Alexander P O. 1981. Strontium-isotopic composition of Dhandhuka basalts, western India. Chemical Geology, 32(1-4): 129-138.
doi: 10.1016/0009-2541(81)90134-0
[5]   Allen R G, Pereira L S, Raes D, et al. 1998. Crop evapotranspiration-Guidelines for computing crop water requirements - FAO Irrigation and drainage paper 56. Food and Agriculture Organization of the United Nations (FAO), Rome, 300(9): D05109. [2022-07-15]. https://www.fao.org/3/x0490e/x0490e00.htm.
[6]   Buishand T A. 1982. Some methods for testing the homogeneity of rainfall records. Journal of Hydrology, 58(1-2): 11-27.
doi: 10.1016/0022-1694(82)90066-X
[7]   Dai S, Li L, Xu H, et al. 2013. A system dynamics approach for water resources policy analysis in arid land: a model for Manas River Basin. Journal of Arid Land, 5(1): 118-131.
doi: 10.1007/s40333-013-0147-1
[8]   Das J, Poonia V, Jha S, et al. 2020. Understanding the climate change impact on crop yield over Eastern Himalayan Region: ascertaining GCM and scenario uncertainty. Theoretical and Applied Climatology, 142(1): 467-482.
doi: 10.1007/s00704-020-03332-y
[9]   de Azevedo P V, de Souza C B, da Silva, et al. 2007. Water requirements of pineapple crop grown in a tropical environment, Brazil. Agricultural Water Management, 88(1-3): 201-208.
doi: 10.1016/j.agwat.2006.10.021
[10]   De Silva C S, Weatherhead E K, Knox J W, et al. 2007. Predicting the impacts of climate change—A case study of paddy irrigation water requirements in Sri Lanka. Agricultural Water Management, 93(1-2): 19-29.
doi: 10.1016/j.agwat.2007.06.003
[11]   Döll P. 2002. Impact of climate change and variability on irrigation requirements: a global perspective. Climatic Change, 54(3): 269-293.
doi: 10.1023/A:1016124032231
[12]   Economic Survey. 2021. Economic Survey 2020-2021. [2022-08-15]. https://www.indiabudget.gov.in/economicsurvey/ebook_es2021/index.html.
[13]   Elgaali E, Garcia L A, Ojima D S, et al. 2007. High resolution modeling of the regional impacts of climate change on irrigation water demand. Climatic Change, 84: 441-461.
doi: 10.1007/s10584-007-9278-8
[14]   Elliott J, Deryng D, Müller C, et al. 2014. Constraints and potentials of future irrigation water availability on agricultural production under climate change. Proceedings of the National Academy of Sciences, 111(9): 3239-3244.
[15]   Ewaid S H, Abed S A, Al-Ansari N. 2019. Crop water requirements and irrigation schedules for some major crops in Southern Iraq. Water, 11(4): 756, doi: 10.3390/w11040756.
doi: 10.3390/w11040756
[16]   Eyring V, Bony S, Meehl G A, et al. 2016. Overview of the Coupled Model Intercomparison Project Phase 6 (CMIP6) experimental design and organization. Geoscientific Model Development, 9(5): 1937-1958.
doi: 10.5194/gmd-9-1937-2016
[17]   Farooq M S, Uzaiir M, et al. 2022. Uncovering the research gaps to alleviate the negative impacts of climate change on food security: A review. Frontiers in Plant Science, 13: 927535, doi: 10.3389/fpls.2022.927535.
doi: 10.3389/fpls.2022.927535
[18]   Flörke M, Schneider C, McDonald R I. 2018. Water competition between cities and agriculture driven by climate change and urban growth. Nature Sustainability, 1(1): 51-58.
doi: 10.1038/s41893-017-0006-8
[19]   Gondim R, Silveira C, de Souza Filho F, et al. 2018. Climate change impacts on water demand and availability using CMIP 5 models in the Jaguaribe basin, semi-arid Brazil. Environmental Earth Sciences, 77(15): 1-14.
doi: 10.1007/s12665-017-7169-5
[20]   Guhathakurta P, Saji E. 2013. Detecting changes in rainfall pattern and seasonality index vis-à-vis increasing water scarcity in Maharashtra. Journal of Earth System Science, 122(3): 639-649.
doi: 10.1007/s12040-013-0294-y
[21]   Guhathakurta P, Khedika S, Menon P, et al. 2020. Observed rainfall variability and changes over Maharashtra State. Met Monograph No. ESSO/IMD/HS/Rainfall Variability/16 (2020)/40, India Meteorological Department, Pune. [2021-10-15]. https://imdpune.gov.in/hydrology/rainfall%20variability%20page/maharashtra_final.pdf.
[22]   Gulati A, Gayathri M. 2018. Towards sustainable, productive and profitable agriculture: Case of rice and sugarcane, Working Paper, No. 358, Indian Council for Research on International Economic Relations (ICRIER), New Delhi. [2021-10-15]. http://hdl.handle.net/10419/203692.
[23]   Gupta V, Singh V, Jain M K. 2020. Assessment of precipitation extremes in India during the 21st century under SSP1-1.9 mitigation scenarios of CMIP6 GCMs. . Journal of Hydrology, 590: 125422, doi: 10.1016/j.jhydrol.2020.125422.
doi: 10.1016/j.jhydrol.2020.125422
[24]   Haj-Amor Z, Acharjee T K, Dhaouadi L, et al. 2020. Impacts of climate change on irrigation water requirement of date palms under future salinity trend in coastal aquifer of Tunisian oasis. Agricultural Water Management, 228: 105843, doi: 10.1016/j.agwat.2019.105843.
doi: 10.1016/j.agwat.2019.105843
[25]   Hooper P, Widdowson M, Kelley S. 2010. Tectonic setting and timing of the final Deccan flood basalt eruptions. Geology, 38(9): 839-842.
doi: 10.1130/G31072.1
[26]   Irmak S, Odhiambo L O, Specht J E, et al. 2013. Hourly and daily single and basal evapotranspiration crop coefficients as a function of growing degree days, days after emergence, leaf area index, fractional green canopy cover, and plant phenology for soybean. Transactions of the American Society of Agricultural and Biological Engineers, 56(5): 1785-1803.
[27]   Jain S K, Singh P K. 2020. Major challenges that climate change will bring to hydrologists. Journal of Hydrologic Engineering, 25(9): 02520002, doi: 10.1061/(ASCE)HE.1943-5584.0001989.
doi: 10.1061/(ASCE)HE.1943-5584
[28]   Kim Y H, Min S K, Zhang X, et al. 2020. Evaluation of the CMIP 6 multi-model ensemble for climate extreme indices. Weather Climate Extremes, 29: 100269, doi: 10.1016/j.wace.2020.100269.
doi: 10.1016/j.wace.2020.100269
[29]   Konzmann M, Gerten D, Heinke J. 2013. Climate impacts on global irrigation requirements under 19 GCMs, simulated with a vegetation and hydrology model. Hydrological Sciences, 58(1): 88-105.
doi: 10.1080/02626667.2013.746495
[30]   Li J, Fei L, Li S, et al. 2020. Development of "water-suitable" agriculture based on a statistical analysis of factors affecting irrigation water demand. Science of the Total Environment, 744: 140986, doi: 10.1016/j.scitotenv.2020.140986.
doi: 10.1016/j.scitotenv.2020.140986
[31]   Luo W, Chen M, Kang Y, et al. 2022. Analysis of crop water requirements and irrigation demands for rice: Implications for increasing effective rainfall. Agricultural Water Management, 260: 107285, doi: 10.1016/j.agwat.2021.107285.
doi: 10.1016/j.agwat.2021.107285
[32]   Masia S, Trabucco A, Spano D, et al. 2021. A modelling platform for climate change impact on local and regional crop water requirements. Agricultural Water Management, 255: 107005, doi: 10.1016/j.agwat.2021.107005.
doi: 10.1016/j.agwat.2021.107005
[33]   Mishra V, Bhatia U, Tiwari A D. 2020. Bias-corrected climate projections for South Asia from Coupled Model Intercomparison Project-6. Scientific Data, 7(1): 1-13.
doi: 10.1038/s41597-019-0340-y
[34]   Mondal S K, Tao H, Huang J, et al. 2021. rojected changes in temperature, precipitation and potential evapotranspiration across Indus River Basin at 1.5-3.0°C warming levels using CMIP6-GCMs. Science of the Total Environment, 789: 147867, doi: 10.1016/j.scitotenv.2021.147867.
doi: 10.1016/j.scitotenv.2021.147867
[35]   Moseki O, Murray-Hudson M, Kashe K. 2019. Crop water and irrigation requirements of Jatropha curcas L. in semi-arid conditions of Botswana: applying the CROPWAT model. Agricultural Water Management, 225: 105754, doi: 10.1016/j.agwat.2019.105754.
doi: 10.1016/j.agwat.2019.105754
[36]   Muñoz G, Grieser J. 2006. CLIMWAT 2.0 for CROPWAT. Water Resources, Development and Management Service, 1-5. [2021-10-15]. http://www.juergen-grieser.de/downloads/CLIMWAT_2.pdf.
[37]   Peterson T C, Easterling D R. 1994. Creation of homogeneous composite climatological reference series. International Journal of Climatology, 14(6): 671-679.
doi: 10.1002/joc.3370140606
[38]   Peterson T C, Easterling D R, Karl T R, et al. 1998. Homogeneity adjustments of in situ atmospheric climate data: a review. International Journal of Climatology, 18(13): 1493-1517.
doi: 10.1002/(SICI)1097-0088(19981115)18:13<1493::AID-JOC329>3.0.CO;2-T
[39]   Poonia V, Das J, Goyal M K. 2021. Impact of climate change on crop water and irrigation requirements over eastern Himalayan region. Stochastic Environmental Research and Risk Assessment, 35(6): 1175-1188.
doi: 10.1007/s00477-020-01942-6
[40]   Ravindranath N H, Rao S, Sharma N, et al. 2011. Climate change vulnerability profiles for North East India. Current Science, 101(3): 384-394.
[41]   Rehana S, Mujumdar P P. 2013. Regional impacts of climate change on irrigation water demands. Hydrological Processes, 27(20): 2918-2933.
[42]   Riahi K, Van Vuuren D P, Kriegler E, et al. 2017. The Shared Socioeconomic Pathways and their energy, land use, and greenhouse gas emissions implications: An overview. Global Environmental Change, 42: 153-168.
doi: 10.1016/j.gloenvcha.2016.05.009
[43]   Rosner B. 1983. Percentage points for a generalized ESD may-outlier procedure. Technometrics, 25: 165-172.
doi: 10.1080/00401706.1983.10487848
[44]   Savva A P, Frenken K. 2002. Crop water requirements and irrigation scheduling. Harare: FAO Sub-Regional Office for East and Southern Africa. [2021-10-15]. https://www.fao.org/3/ai593e/ai593e.pdf.
[45]   Schwaller C, Keller Y, Helmreich B, et al. 2021. Estimating the agricultural irrigation demand for planning of non-potable water reuse projects. Agricultural Water Management, 244: 106529, doi: 10.1016/j.agwat.2020.106529.
doi: 10.1016/j.agwat.2020.106529
[46]   Shrestha S, Gyawali B, Bhattarai U. 2013. Impacts of climate change on irrigation water requirements for rice-wheat cultivation in Bagmati River Basin, Nepal. Journal of Water and Climate Change, 4(4): 422-439.
doi: 10.2166/wcc.2013.050
[47]   Singh D, Gupta R D, Jain S K. 2015a. Study of daily extreme temperature indices over Sutlej Basin, NW Himalayan region, India. Global Nest Journal, 17(2): 301-311.
doi: 10.30955/gnj.001520
[48]   Singh D, Jain S K, Gupta R D. 2015b. Trend in observed and projected maximum and minimum temperature over NW Himalayan basin. Journal of Mountain Science, 12(2): 417-433.
doi: 10.1007/s11629-013-2889-9
[49]   Singh D, Rai S P, Kumar B, et al. 2016. Study of hydro-chemical characteristics of Lake Nainital in response of human interventions, and impact of twentieth century climate change. Environmental Earth Sciences, 75(20): 1380, doi: 10.1007/s12665-016-6177-1.
doi: 10.1007/s12665-016-6177-1
[50]   Singh R N, Sah S, Das B, et al. 2021. Spatio-temporal trends and variability of rainfall in Maharashtra, India: Analysis of 118 years. Theoretical and Applied Climatology, 143(3): 883-900.
doi: 10.1007/s00704-020-03452-5
[51]   Smith M, Kivumbi D, Heng L K. 2002. Use of the FAO CROPWAT model in deficit irrigation studies. [2022-01-17]. https://www.fao.org/3/Y3655E/Y3655E00.htm.
[52]   Sun G. 2013. Impacts of climate change and variability on water resources in the Southeast USA. In: Ingram K T, Dow K, Carter L, et al. Climate of the Southeast United States. NCA Regional Input Reports. Washington DC: Island Press, 210-236.
[53]   Todmal R S. 2021. Future climate change scenario over Maharashtra, Western India: Implications of the Regional Climate Model (REMO-2009) for the understanding of agricultural vulnerability. Pure and Applied Geophysics, 178(1): 155-168.
doi: 10.1007/s00024-020-02642-6
[54]   Tubiello F N, Fischer G. 2007. Reducing climate change impacts on agriculture: Global and regional effects of mitigation, 2000-2080. Technological Forecasting and Social Change, 74(7): 1030-1056.
doi: 10.1016/j.techfore.2006.05.027
[55]   Wada Y, Wisser D, Eisner S, et al. 2013. Multimodel projections and uncertainties of irrigation water demand under climate change. Geophysical Research Letters, 40(17): 4626-4632.
doi: 10.1002/grl.50686
[56]   Wellman P, McElhinny M W. 1970. K-Ar age of the Deccan Trap, India. Nature, 227: 595-596.
doi: 10.1038/227595a0
[57]   Widdowson M, Mitchel C. 1999. Large scale stratigraphical, structural and geomorphological constraints for earthquakes in the southern Deccan Traps, India: the case for denudationally-driven seismicity. Geological Society of India, 43: 425-452.
[58]   Ye Q, Yang X, Dai S, et al. 2015. Effects of climate change on suitable rice cropping areas, cropping systems and crop water requirements in southern China. Agricultural Water Management, 159: 35-44.
doi: 10.1016/j.agwat.2015.05.022
[59]   Yu Y, Pi Y, Yu X, et al. 2019. Climate change, water resources and sustainable development in the arid and semi-arid lands of Central Asia in the past 30 years. Journal of Arid Land, 11(1): 1-14.
doi: 10.1007/s40333-018-0073-3
[1] ZHAO Xuqin, LUO Min, MENG Fanhao, SA Chula, BAO Shanhu, BAO Yuhai. Spatiotemporal changes of gross primary productivity and its response to drought in the Mongolian Plateau under climate change[J]. Journal of Arid Land, 2024, 16(1): 46-70.
[2] Mitiku A WORKU, Gudina L FEYISA, Kassahun T BEKETIE, Emmanuel GARBOLINO. Projecting future precipitation change across the semi-arid Borana lowland, southern Ethiopia[J]. Journal of Arid Land, 2023, 15(9): 1023-1036.
[3] QIN Guoqiang, WU Bin, DONG Xinguang, DU Mingliang, WANG Bo. Evolution of groundwater recharge-discharge balance in the Turpan Basin of China during 1959-2021[J]. Journal of Arid Land, 2023, 15(9): 1037-1051.
[4] MA Jinpeng, PANG Danbo, HE Wenqiang, ZHANG Yaqi, WU Mengyao, LI Xuebin, CHEN Lin. Response of soil respiration to short-term changes in precipitation and nitrogen addition in a desert steppe[J]. Journal of Arid Land, 2023, 15(9): 1084-1106.
[5] ZHANG Hui, Giri R KATTEL, WANG Guojie, CHUAI Xiaowei, ZHANG Yuyang, MIAO Lijuan. Enhanced soil moisture improves vegetation growth in an arid grassland of Inner Mongolia Autonomous Region, China[J]. Journal of Arid Land, 2023, 15(7): 871-885.
[6] ZHANG Zhen, XU Yangyang, LIU Shiyin, DING Jing, ZHAO Jinbiao. Seasonal variations in glacier velocity in the High Mountain Asia region during 2015-2020[J]. Journal of Arid Land, 2023, 15(6): 637-648.
[7] GAO Xiang, WEN Ruiyang, Kevin LO, LI Jie, YAN An. Heterogeneity and non-linearity of ecosystem responses to climate change in the Qilian Mountains National Park, China[J]. Journal of Arid Land, 2023, 15(5): 508-522.
[8] Reza DEIHIMFARD, Sajjad RAHIMI-MOGHADDAM, Farshid JAVANSHIR, Alireza PAZOKI. Quantifying major sources of uncertainty in projecting the impact of climate change on wheat grain yield in dryland environments[J]. Journal of Arid Land, 2023, 15(5): 545-561.
[9] Sakine KOOHI, Hadi RAMEZANI ETEDALI. Future meteorological drought conditions in southwestern Iran based on the NEX-GDDP climate dataset[J]. Journal of Arid Land, 2023, 15(4): 377-392.
[10] Mehri SHAMS GHAHFAROKHI, Sogol MORADIAN. Investigating the causes of Lake Urmia shrinkage: climate change or anthropogenic factors?[J]. Journal of Arid Land, 2023, 15(4): 424-438.
[11] ZHANG Yixin, LI Peng, XU Guoce, MIN Zhiqiang, LI Qingshun, LI Zhanbin, WANG Bin, CHEN Yiting. Temporal and spatial variation characteristics of extreme precipitation on the Loess Plateau of China facing the precipitation process[J]. Journal of Arid Land, 2023, 15(4): 439-459.
[12] Adnan ABBAS, Asher S BHATTI, Safi ULLAH, Waheed ULLAH, Muhammad WASEEM, ZHAO Chengyi, DOU Xin, Gohar ALI. Projection of precipitation extremes over South Asia from CMIP6 GCMs[J]. Journal of Arid Land, 2023, 15(3): 274-296.
[13] ZHAO Lili, LI Lusheng, LI Yanbin, ZHONG Huayu, ZHANG Fang, ZHU Junzhen, DING Yibo. Monitoring vegetation drought in the nine major river basins of China based on a new developed Vegetation Drought Condition Index[J]. Journal of Arid Land, 2023, 15(12): 1421-1438.
[14] CAO Yijie, MA Yonggang, BAO Anming, CHANG Cun, LIU Tie. Evaluation of the water conservation function in the Ili River Delta of Central Asia based on the InVEST model[J]. Journal of Arid Land, 2023, 15(12): 1455-1473.
[15] YAN Xue, LI Lanhai. Spatiotemporal characteristics and influencing factors of ecosystem services in Central Asia[J]. Journal of Arid Land, 2023, 15(1): 1-19.