| Research article |
|


|
|
|
| Using statistical models and GIS to delimit the groundwater recharge potential areas and to estimate the infiltration rate: A case study of Nadhour-Sisseb-El Alem Basin, Tunisia |
Ali SOUEI1,2,*( ), Taher ZOUAGHI3 ), Taher ZOUAGHI3 |
1Georesources Laboratory, Water Researches and Technologies Center (WRTC) of Borj Cedria, Soliman 8020, Tunisia
2Department of Geology, FST, University of Tunis El Manar, Tunis C P 2092, Tunisia
3Department of Geo-Exploration Techniques, Faculty of Earth Sciences, King Abdulaziz University, Jeddah 21589, Saudi Arabia |
|
|
|
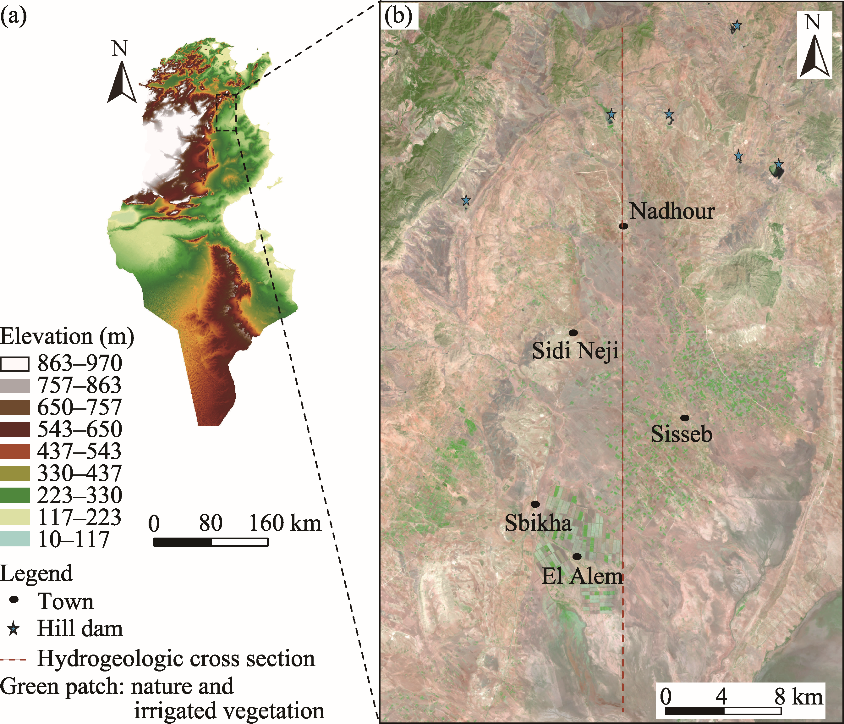
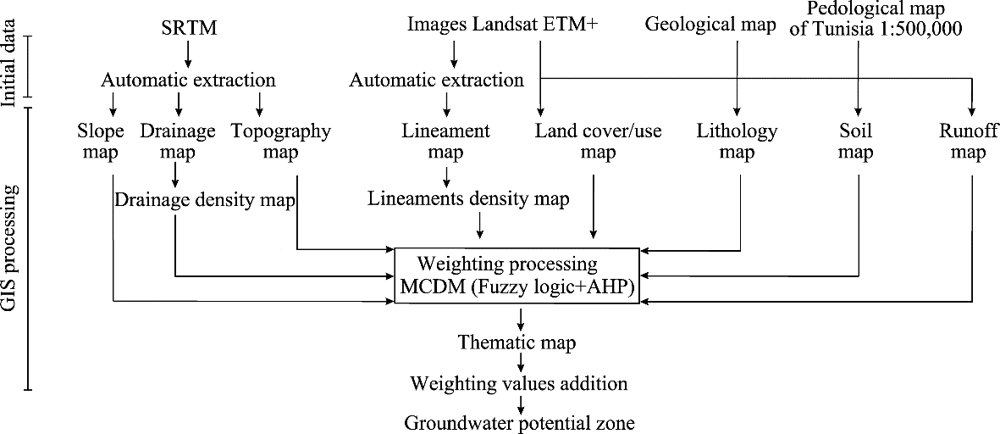
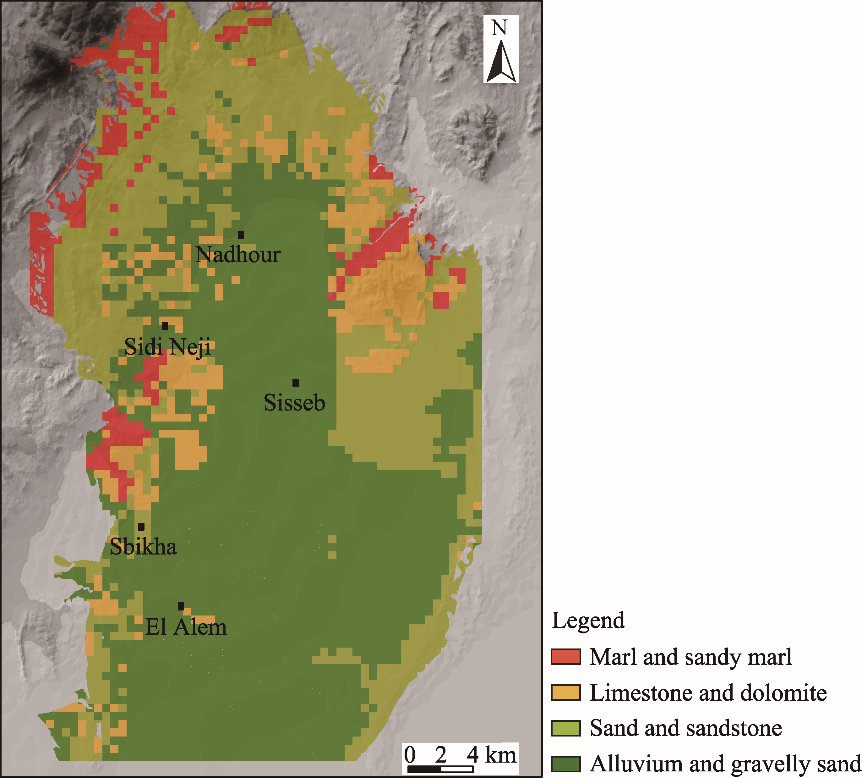
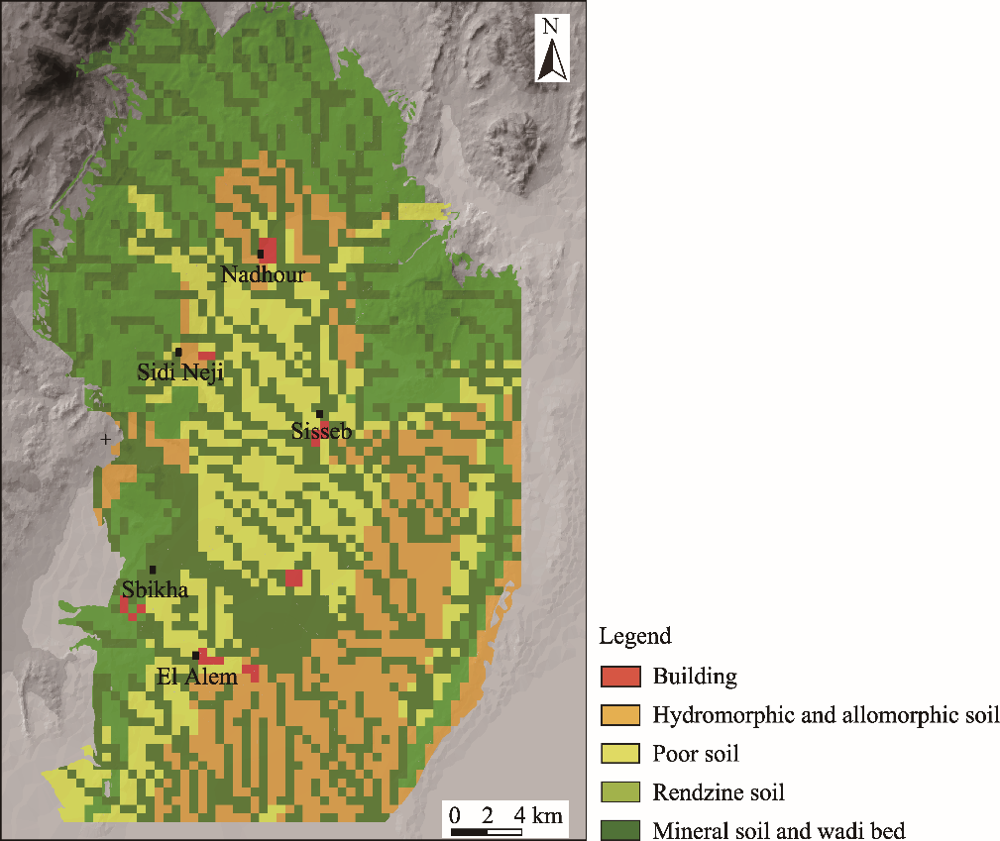
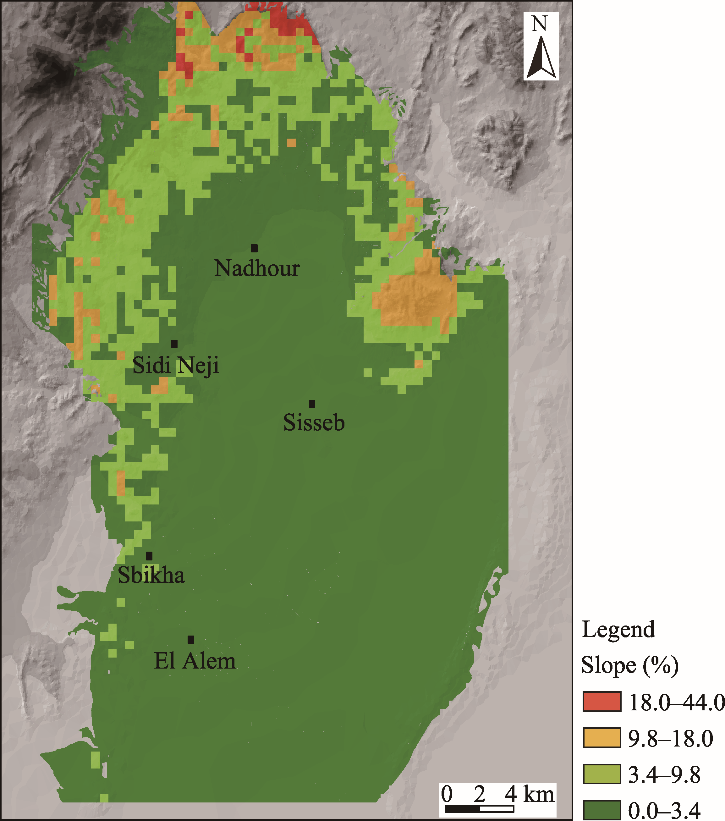
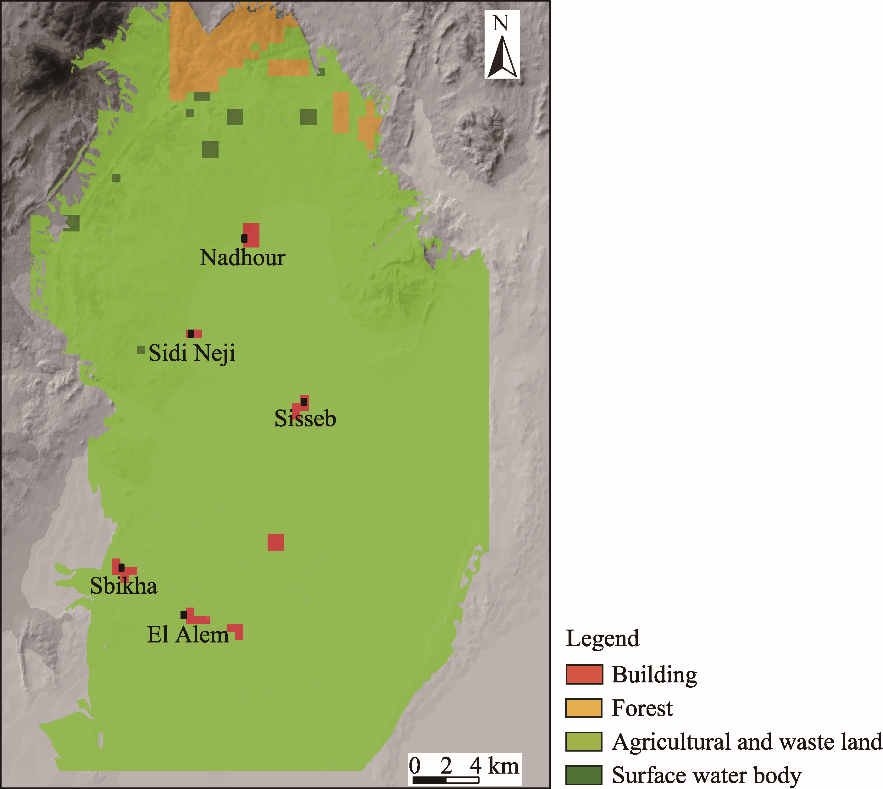
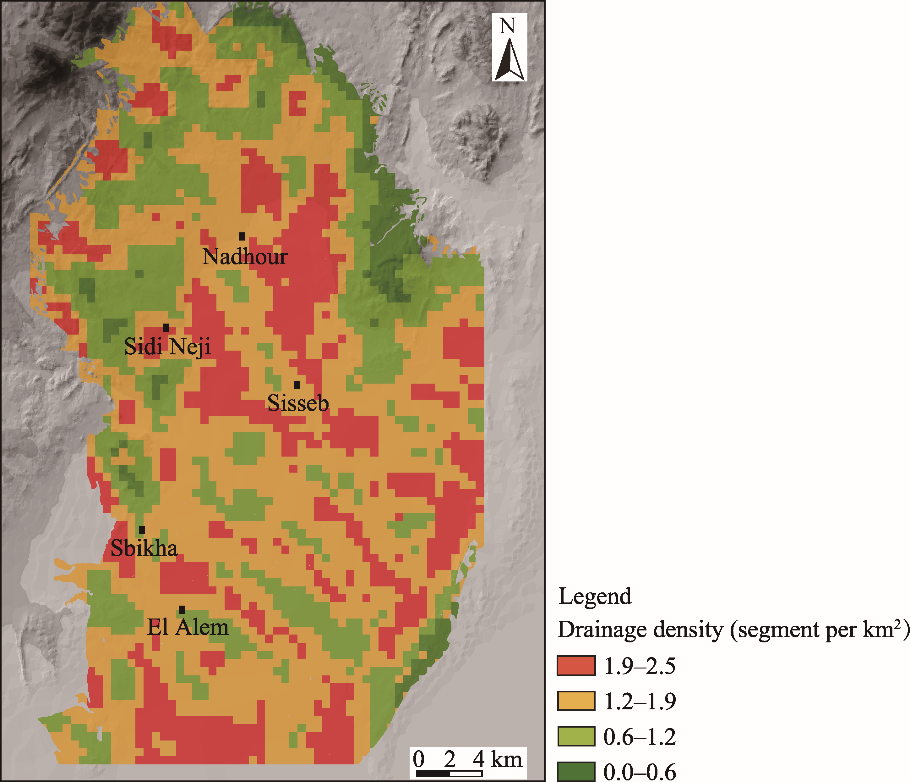
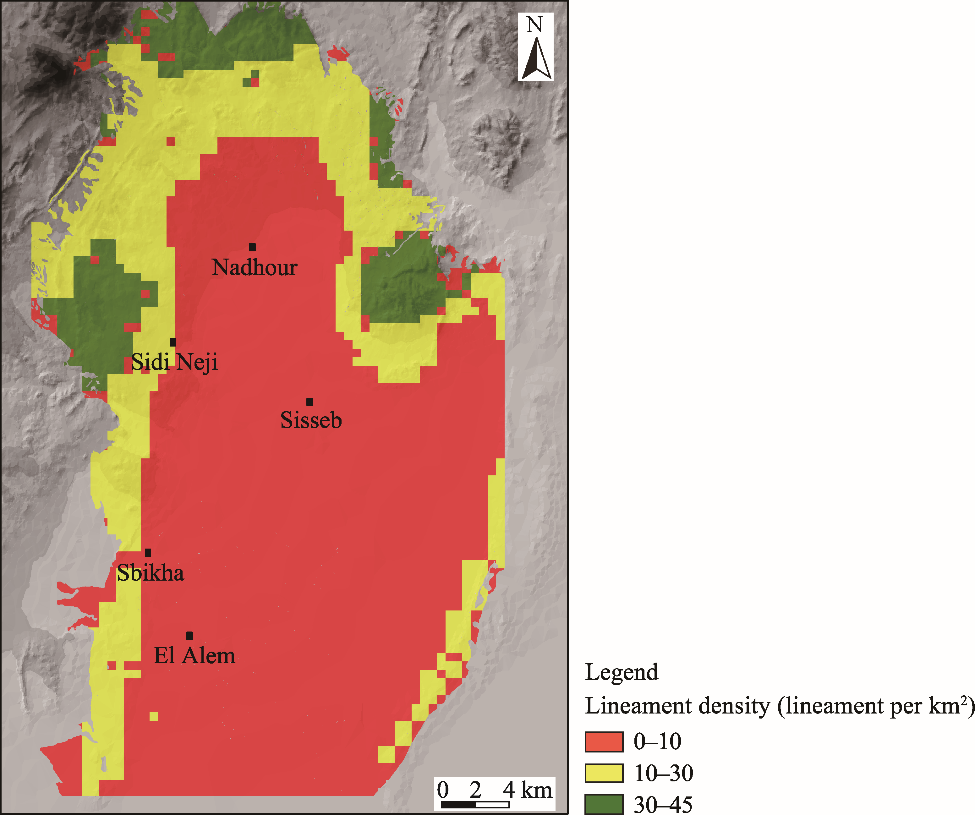
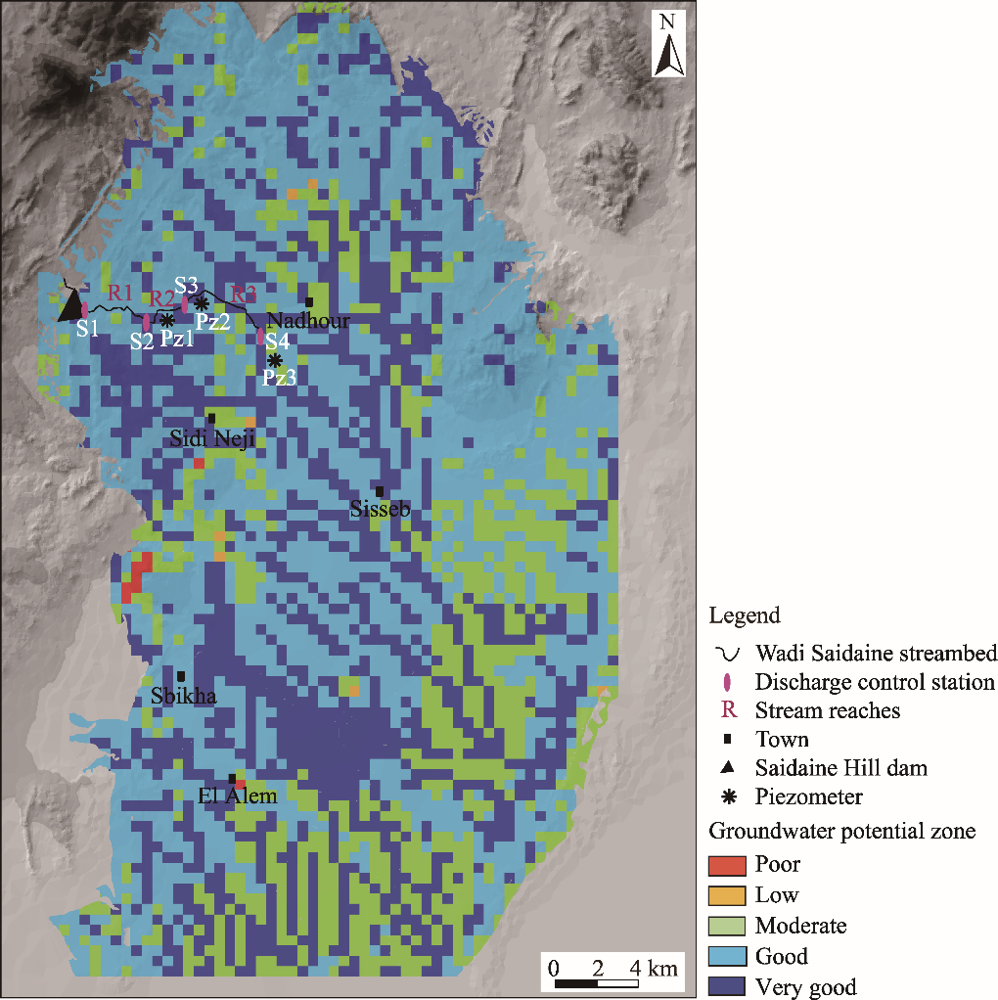
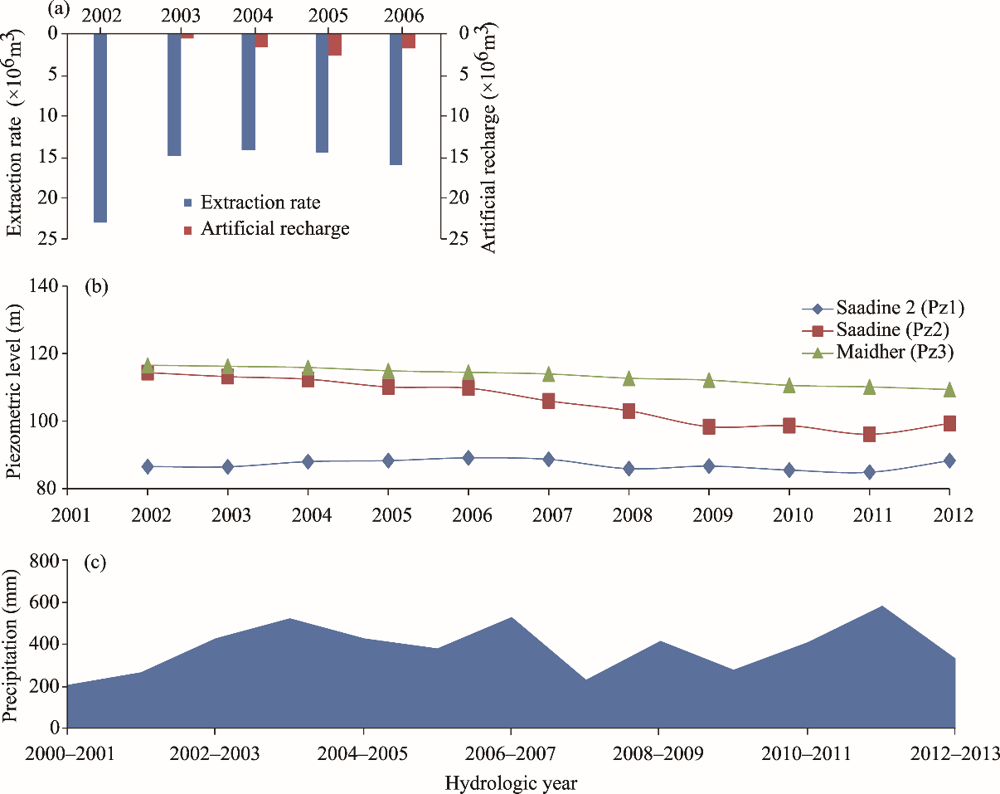
Abstract The water resources of the Nadhour-Sisseb-El Alem Basin in Tunisia exhibit semi-arid and arid climatic conditions. This induces an excessive pumping of groundwater, which creates drops in water level ranging about 1-2 m/a. Indeed, these unfavorable conditions require interventions to rationalize integrated management in decision making. The aim of this study is to determine a water recharge index (WRI), delineate the potential groundwater recharge area and estimate the potential groundwater recharge rate based on the integration of statistical models resulted from remote sensing imagery, GIS digital data (e.g., lithology, soil, runoff), measured artificial recharge data, fuzzy set theory and multi-criteria decision making (MCDM) using the analytical hierarchy process (AHP). Eight factors affecting potential groundwater recharge were determined, namely lithology, soil, slope, topography, land cover/use, runoff, drainage and lineaments. The WRI is between 1.2 and 3.1, which is classified into five classes as poor, weak, moderate, good and very good sites of potential groundwater recharge area. The very good and good classes occupied respectively 27% and 44% of the study area. The potential groundwater recharge rate was 43% of total precipitation. According to the results of the study, river beds are favorable sites for groundwater recharge.
|
|
Received: 20 January 2021
Published: 10 November 2021
|
|
Corresponding Authors:
Ali SOUEI (E-mail: soueiali2014@gmail.com)
|
|
|
| [1] |
Al Saud M. 2010. Mapping potential areas for groundwater storage in Wadi Aurnah Basin, western Arabian Peninsula, using remote sensing and geographic information system techniques. Hydrogeology Journal, 18: 1481-1495.
doi: 10.1007/s10040-010-0598-9
|
|
|
| [2] |
Aouragh M H, Essahlaoui A, El Ouali A, et al. 2016. Groundwater potential of Middle Atlas plateaus, Morocco, using fuzzy logic approach, GIS and remote sensing. Geomatics, Natural Hazards and Risk, 8(2): 194-206.
doi: 10.1080/19475705.2016.1181676
|
|
|
| [3] |
Ayadi M. 2014. Artificial recharge of underground aquifers in Tunisia. In:Ministry of Agriculture and Hydraulic Resources. General Water Resources Direction Report Note TN190. Tunis, Tunisia. (in French).
|
|
|
| [4] |
Bresciani E. 2011. Modeling of climatic, topographic, geological and anthropogenic controls on underground flows in the basement area. PhD Dissertation. La Chapelle-Thouarault: University Rennes 1. (in French).
|
|
|
| [5] |
Buckley J J. 1984. The multiple judge, multiple criteria ranking problem: a fuzzy set approach. Fuzzy Sets and Systems, 13(1): 25-37.
doi: 10.1016/0165-0114(84)90024-1
|
|
|
| [6] |
Chenini I, Ben Mammou A, El May M. 2010. Groundwater recharge zone mapping using GIS-based multi-criteria analysis: a case study in Central Tunisia (Maknassy Basin). Water Resources Management, 24: 921-939.
doi: 10.1007/s11269-009-9479-1
|
|
|
| [7] |
Elewa H H, Qaddah A A. 2011. Groundwater potentiality mapping in the Sinai Peninsula, Egypt, using remote sensing and GIS-watershed-based modeling. Hydrogeology Journal, 19: 613-628.
doi: 10.1007/s10040-011-0703-8
|
|
|
| [8] |
Freeze R A, Witherspoon P A. 1967. Theoretical analysis of regional groundwater flow: 2. Effect of water-table configuration and subsurface permeability variation. Water Resources Research, 3(2): 623-634.
doi: 10.1029/WR003i002p00623
|
|
|
| [9] |
Greenbaum D. 1985. Review of remote sensing applications to groundwater exploration in basement and regolith. British Geological Survey. Nottingham, UK.
|
|
|
| [10] |
GWRD. 2012. Piezometric level of underground aquifers in Tunisia. In: General Water Resources Direction Report Note TN180. Tunis, Tunisia. (in French)
|
|
|
| [11] |
GWRD. 2013a. Precipitation in Tunisia. In: General Water Resources Direction Report Note TN179. Tunis, Tunisia. (in French)
|
|
|
| [12] |
GWRD General Water Resources Direction. 2013b. Aquifer recharge and groundwater extraction. In: General Water Resources Direction Report Note TN380. Tunis, Tunisia. (in French)
|
|
|
| [13] |
Haitjema H M, Mitchell-Bruker S. 2005. Are water tables a subdued replica of the topography? Ground Water, 43(6): 781-786.
|
|
|
| [14] |
Harlin J M, Wijeyawickrema C. 1985. Irrigation and groundwater depletion in Caddo County, Oklahoma. Journal of the American Water Resources Association, 21(1): 15-22.
doi: 10.1111/jawr.1985.21.issue-1
|
|
|
| [15] |
Hillel D. 1982. Introduction to Soil Physcics. San Diego: Academic press. 22.
|
|
|
| [16] |
Ibn Ali Z, Triki I, Lajili-Ghezal L, et al. 2017. A method to estimate aquifer artificial recharge from a hill dam in Tunisia. Journal of Arid Land, 9(2): 244-255.
doi: 10.1007/s40333-017-0002-x
|
|
|
| [17] |
Jaiswal R K, Mukherjee S, Krishnamurthy J, et al. 2003. Role of remote sensing and GIS techniques for generation of groundwater prospect zones towards rural development an approach. International Journal of Remote Sensing, 24(5): 993-1008.
doi: 10.1080/01431160210144543
|
|
|
| [18] |
Jasrotia A S, Bhagat B D, Kumar A, et al. 2013. Remote sensing and GIS approach for delineation of groundwater potential and groundwater quality zones of western Doon Valley, Uttarakhand, India. Journal of the Indian Society of Remote Sensing, 41: 365-377.
doi: 10.1007/s12524-012-0220-9
|
|
|
| [19] |
Jha M K, Chowdhury A, Chowdary V M, et al. 2007. Groundwater management and development by integrated remote sensing and geographic information systems: prospects and constraints. Water Resources Management, 21: 427-467.
doi: 10.1007/s11269-006-9024-4
|
|
|
| [20] |
Kallali H, Anan M, Jellali S, et al. 2007. GIS-based multi-criteria analysis for potential wastewater aquifer recharge sites. Desalination, 215(1-3): 111-119.
doi: 10.1016/j.desal.2006.11.016
|
|
|
| [21] |
Kirpich Z P. 1940. Time of concentration of small agricultural watersheds. International Journal of Civil Engineering, 10(6): 362.
|
|
|
| [22] |
Krishnamurthy J, Mani A, Jayaraman V, et al. 2000. Groundwater resources development in hard rock terrain: An approach using remote sensing and GIS techniques. International Journal of Applied Earth Observation and Geoinformation, 2(3-4): 204-215.
doi: 10.1016/S0303-2434(00)85015-1
|
|
|
| [23] |
Larue J P. 2000. Contribution of concentrated runoff to the erosion of cultivated sandy soils in the west of the Paris Basin: the example of the Dué and Narais basins. Ingenieries-EAT, 21: 51-62. (in French)
|
|
|
| [24] |
Leberling H. 1981. On finding compromise solutions in multicriteria problems using the fuzzy min-operator. Fuzzy Sets and Systems, 6(2): 105-118.
doi: 10.1016/0165-0114(81)90019-1
|
|
|
| [25] |
Leduc C, Favreau G, Schroeter P. 2001. Long-term rise in a Sahelian water-table: the Continental Terminal in South-West Niger. Journal of Hydrology, 243(1-2): 43-54.
doi: 10.1016/S0022-1694(00)00403-0
|
|
|
| [26] |
Lowery B, Hickey W J, Arshad M A, et al. 1997. Soil water parameters and soil quality. In: Doran J W, A J Jones. Methods for Assessing Soil Quality. Madison: Soil Science Society of America, Inc., 143-155.
|
|
|
| [27] |
Luo W. 1900. Quantifying groundwater-sapping landforms with a hypsometric technique. Journal of Geophysical Research, 105(E1): 1685-1694.
doi: 10.1029/1999JE001096
|
|
|
| [28] |
Machiwal D, Jha M K, Mal B C. 2011. Assessment of groundwater potential in a semi-arid region of India using remote sensing, GIS and MCDM techniques. Water Resources Management, 25: 1359-1386.
doi: 10.1007/s11269-010-9749-y
|
|
|
| [29] |
Madrucci V, Fabio T, de Araújo C C. 2008. Groundwater favorability map using GIS multicriteria data analysis on crystalline terrain, São Paulo State, Brazil. Journal of Hydrology, 357(3-4): 153-173.
doi: 10.1016/j.jhydrol.2008.03.026
|
|
|
| [30] |
Morsli B M, Mazour N, Mededjel A H, et al. 2004. Influence of land use on the risks of runoff and erosion on the semi-arid area of northwestern Algeria. Drought, 15(1): 96-104. (in French)
|
|
|
| [31] |
Napolitano P, and Fabbri A. 1996. Single-parameter sensitivity analysis for aquifer vulnerability assessment using DRASTIC and SINTACS. In:HydroGIS 96: Application of Geographical Information Systems in Hydrology and Water Resources Management, Proceedings of Vienna Conference. Vienna: IAHS Pub, 235: 559-566.
|
|
|
| [32] |
Preeja K R, Joseph S, Thomas J, et al. 2011. Identification of groundwater potential zones of a tropical river basin (Kerala, India) using remote sensing and GIS techniques. Journal of the Indian Society of Remote Sensing, 39: 83-94
doi: 10.1007/s12524-011-0075-5
|
|
|
| [33] |
Rashid M, Lone M, Ahmed S. 2012. Integrating geospatial and ground geophysical information as guidelines for groundwater potential zones in hard rock terrains of south India. Environmental Monitoring and Assessment, 184: 4829-4839.
doi: 10.1007/s10661-011-2305-2
|
|
|
| [34] |
Rahman A, Kumar S, Fazal S, et al. 2012. Assessment of land use/land cover change in the north-west district of Delhi using remote sensing and GIS techniques. Journal of the Indian Society of Remote Sensing, 40: 689-697.
doi: 10.1007/s12524-011-0165-4
|
|
|
| [35] |
Rezaei F, Hamid R, Safavi D, et al. 2013. Groundwater vulnerability assessment using fuzzy logic: A case study in the Zayandehrood Aquifers, Iran. Environmental Management, 51: 267-277.
doi: 10.1007/s00267-012-9960-0
|
|
|
| [36] |
Riad P H, Billib M H, Hassan A A, et al. 2011a. Water scarcity management in a semi-arid area in Egypt: overlay weighted model and Fuzzy logic to determine the best locations for artificial recharge of groundwater. Nile Basin, Water Science and Engineering Journal, 4(1): 24-35.
|
|
|
| [37] |
Riad P H, Billib M, Hassan A A, et al. 2011b. Application of the overlay weighted model and Boolean logic to determine the best locations for artificial recharge of groundwater. Journal of Urban and Environmental Engineering, 5(2): 57-66.
doi: 10.4090/juee
|
|
|
| [38] |
Rognon P. 2000. How to develop artificial groundwater recharge in dry regions. Drought, 11: 289-296. (in French)
|
|
|
| [39] |
Saaty T L. 1980. The Analytic Hierarchy Process:Planning, Priority Setting, Resource Allocation. New York (NY): McGraw-Hill International Book Company.
|
|
|
| [40] |
Sauvadet M, Raclot DA, Ben Slimane A, et al. 2012. Determinism of runoff and water erosion from the plot to the slope in a marly Mediterranean environment. Moroccan Journal of Agronomic and Veterinary Sciences, 1: 41-46. (in French)
|
|
|
| [41] |
Shaban A, Khawlie M, Abdallah C. 2006. Use of remote sensing and GIS to determine recharge potential zones: the case of Occidental Lebanon. Hydrogeology Journal, 14: 433-443.
doi: 10.1007/s10040-005-0437-6
|
|
|
| [42] |
Souei A. 2012. Geophysical and hydrogeological characterization of the aquifer systems of the Sisseb-El Alem basin, Central-eastern Tunisia. MSc Thesis. Tunis: University of Tunis El Manar. (in French)
|
|
|
| [43] |
Souei A, Zouaghi T. 2017. Use of GIS for the integrated management of water resources in the region of Central-Eastern Tunisia: Kairouan Nord. Arid Regions Review, 41(1): 265-268. (in French)
|
|
|
| [44] |
Souei A, Mhimdi S, Zouaghi T. 2017. Extraction by remote sensing of fracture networks in the region of Sisseb-El Alem; North Kairouan; hydrogeological implication. In: Abstracts of the 1st Atlas Georesources International Congress. Hammamet: LGR, 20-22. (in French)
|
|
|
| [45] |
Souei A, Atawa M, Zouaghi T. 2018. Hydrogeological framework and geometry modeling via joint gravity and borehole parameters, the Nadhour-Sisseb-El Alem Basin (central-eastern Tunisia). Journal of African Earth Sciences, 139: 133-164.
doi: 10.1016/j.jafrearsci.2017.12.006
|
|
|
| [46] |
Souei A, Zouaghi T. 2018. 2D seismic reflection contribution to structural and geometric study of Cenozoic aquifer systems in the Sisseb El-Alem basin, central-eastern Tunisia. Arabian Journal of Geosciences 11: 689.
doi: 10.1007/s12517-018-4036-y
|
|
|
| [47] |
Souei A. 2019. Contribution of geophysics, remote sensing, GIS, and hydrochemistry to the hydrological and hydrogeological study of aquifer systems in the Nadhour-Sisseb-El Alem basin; Central Eastern Tunisia. PhD Dissertation. Tunis: Tunis-El Manar University.
|
|
|
| [48] |
Souei A, Atawa M, Zouaghi T.2021. 3D seismic velocities modeling and its application in the appreciation of the complex deep framework; the Sisseb-El Alem basin, central-eastern Tunisia. Arabian Journal of Geosciences. 14, 2001 (2021). https://doi.org/10.1007/s12517-021-08300-y.
|
|
|
| [49] |
Toth J. 1963. A theoretical analysis of groundwater flow in small drainage basins. Journal of Geophysical Research, 68(16): 4795-4812.
doi: 10.1029/JZ068i016p04795
|
|
|
| [50] |
Tweed S O, Leblanc M, Webb J A, et al. 2007. Remote sensing and GIS for mapping groundwater recharge and discharge areas in salinity prone catchments, southeastern Australia. Hydrogeology Journal, 15(1): 75-96.
doi: 10.1007/s10040-006-0129-x
|
|
|
| [51] |
Wang Y, Liu Y, Jin J. 2018. Contrast effects of vegetation cover change on evapotranspiration during a revegetation period in the Poyang Lake Basin, China. Forests, 9(4): 217.
doi: 10.3390/f9040217
|
|
|
| [52] |
Winter T C. 2001. The concept of hydrologic landscapes. Journal of the American Water Resources Association, 37(2): 335-349.
doi: 10.1111/jawr.2001.37.issue-2
|
|
|
| [53] |
Yeh H F, Lee C H, Hsu K C, et al. 2009. GIS for the assessment of the groundwater recharge potential zone. Environmental Geology, 58: 185-195.
doi: 10.1007/s00254-008-1504-9
|
|
|
| [54] |
Yeh H F, Cheng YS, Lin H I, et al. 2016. Mapping groundwater recharge potential zone using a GIS approach in Hualian River, Taiwan. Sustainable Environment Research, 26(1): 33-43.
doi: 10.1016/j.serj.2015.09.005
|
|
|
| [55] |
Zadeh L A. 1965. Fuzzy sets. Information and Control, 8(3): 338-353.
doi: 10.1016/S0019-9958(65)90241-X
|
|
|
| [56] |
Zadeh L A. 1987. A computational theory of dispositions. International Journal of Intelligent Systems, 2: 39-63.
|
|
|
| [57] |
Zaoui S. 2009. Contribution of GIS in the study of the sub-watershed of Sidi Ayad (Haute Moulouya, Morocco). MSc Thesis. Meknes: Moulay Ismail University. (in French)
|
|
|
|
Viewed |
|
|
|
Full text
|
|
|
|
|
Abstract
|
|
|
|
|
Cited |
|
|
|
|
| |
Shared |
|
|
|
|
| |
Discussed |
|
|
|
|