| Research article |
|


|
|
|
| Predicting of dust storm source by combining remote sensing, statistic-based predictive models and game theory in the Sistan watershed, southwestern Asia |
Mahdi BOROUGHANI1,*( ), Sima POURHASHEMI2, Hamid GHOLAMI3, Dimitris G KASKAOUTIS4,5 ), Sima POURHASHEMI2, Hamid GHOLAMI3, Dimitris G KASKAOUTIS4,5 |
1Research Center for Geoscience and Social Studies, Hakim Sabzevari University, Sazbevar 9617976487, Iran
2Faculty of Geography and Environmental Sciences, Hakim Sabzevari University, Sabzevar 9617976487, Iran
3Department of Natural Resources Engineering, University of Hormozgan, Hormozgan 7916193145, Iran
4Institute for Environmental Research and Sustainable Development, National Observatory of Athens, Athens 15784, Greece
5Environmental Chemical Processes Laboratory, Department of Chemistry, University of Crete, Crete 70013, Greece |
|
|
|
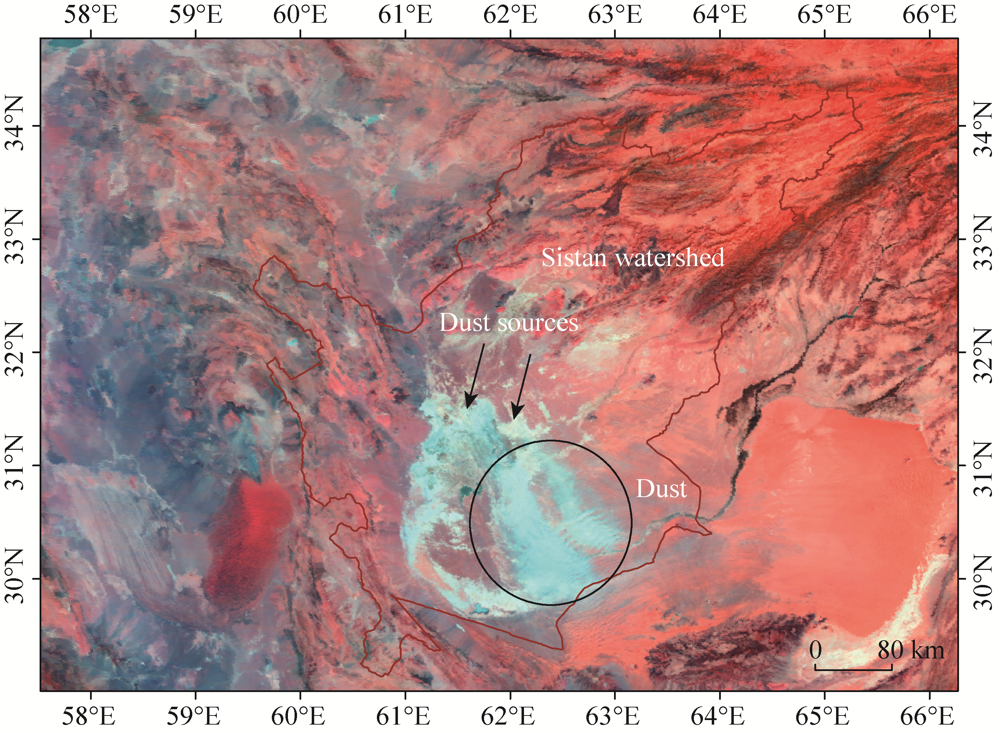
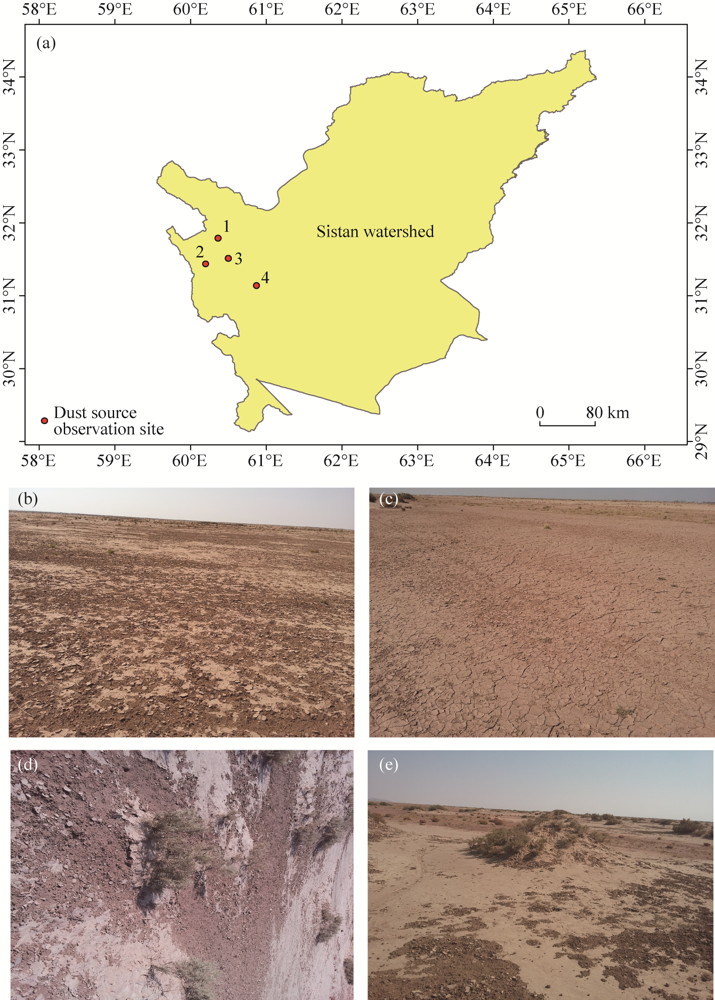
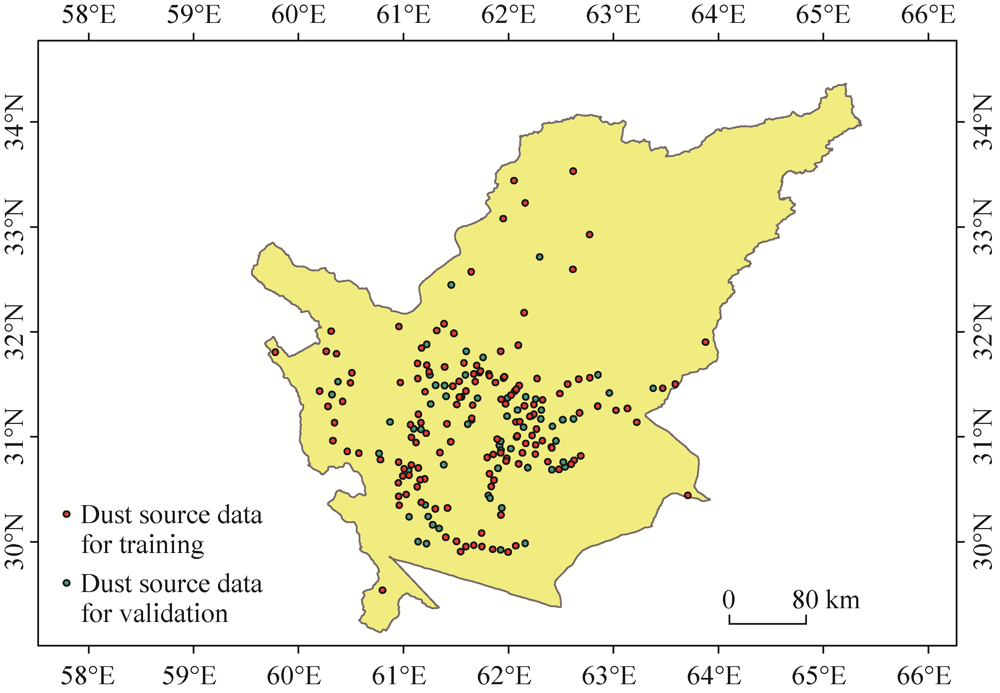
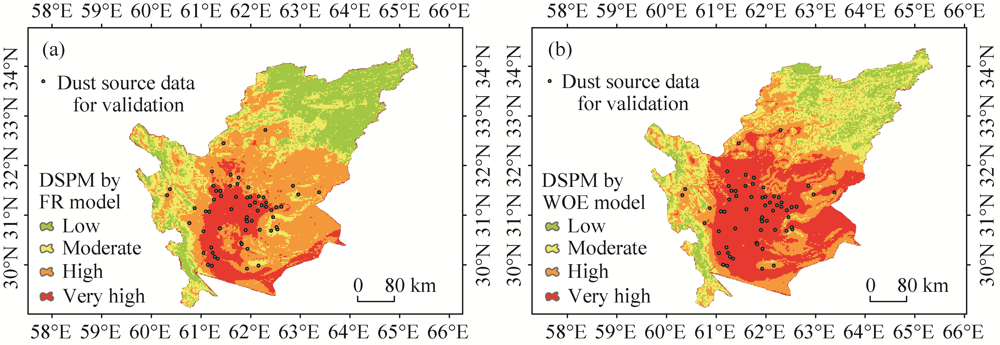
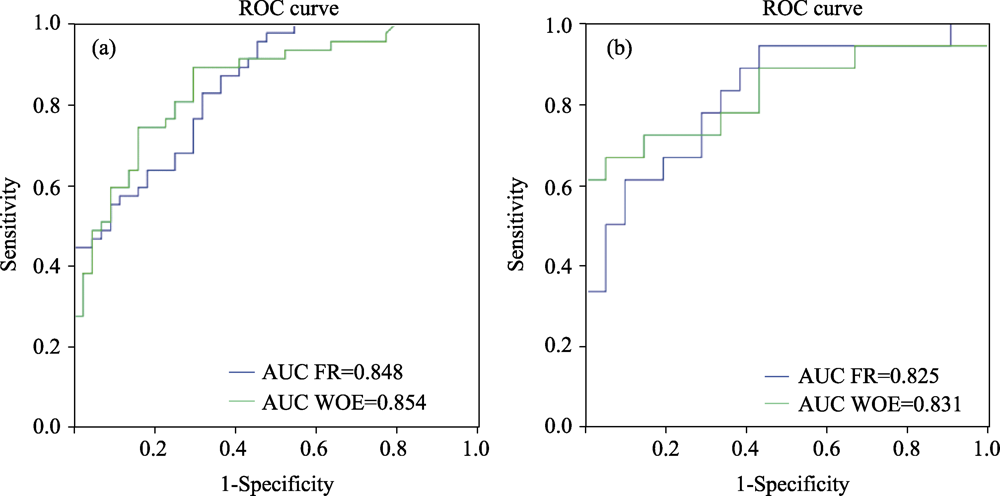
Abstract Dust storms in arid and desert areas affect radiation budget, air quality, visibility, enzymatic activities, agricultural products and human health. Due to increased drought and land use changes in recent years, the frequency of dust storms occurrence in Iran has been increased. This study aims to identify dust source areas in the Sistan watershed (Iran-Afghanistan borders)-an important regional source for dust storms in southwestern Asia, using remote sensing (RS) and bivariate statistical models. Furthermore, this study determines the relative importance of factors controlling dust emissions using frequency ratio (FR) and weights of evidence (WOE) models and interpretability of predictive models using game theory. For this purpose, we identified 211 dust sources in the study area and generated a dust source distribution map-inventory map-by dust source potential index based on RS data. In addition, spatial maps of topographic factors affecting dust source areas including soil, lithology, slope, Normalized difference vegetation index (NDVI), geomorphology and land use were prepared. The performance of two models (WOE and FR) was evaluated using the area under curve (AUC) of the receiver operating characteristic curve. The results showed that soil, geomorphology and slope exhibited the greatest influence in the dust source areas. The 55.3% (according to FR) and 62.6% (according to WOE) of the total area were classified as high and very high potential dust sources, while both models displayed acceptable accuracy with subsurface levels of 0.704 for FR and 0.751 for WOE, although they predict different fractions of dust potential classes. Based on Shapley additive explanations (SHAP), three factors, i.e., soil, slope and NDVI have the highest impact on the model's output. Overall, combination of statistic-based predictive models (or data mining models), RS and game theory techniques can provide accurate maps of dust source areas in arid and semi-arid regions, which can be helpful for mitigation of negative effects of dust storms.
|
|
Received: 12 August 2021
Published: 10 November 2021
|
|
Corresponding Authors:
Mahdi BOROUGHANI (E-mail: m.boroughani@hsu.ac.ir)
|
|
|
| [1] |
Abbasi H, Opp C, Groll M, et al. 2019. Wind regime and sand transport in the Sistan and Registan regions (Iran/Afghanistan). Zeitschrift für Geomorphologie (Suppl.), 62(1): 41-57.
|
|
|
| [2] |
Ackerman S A. 1997. Remote sensing aerosols using satellite infrared observations. Journal of Geophysical Research: Atmospheres, 102(D14): 17069-17079.
doi: 10.1029/96JD03066
|
|
|
| [3] |
Akbari M, Bashiri M, Rangavar A. 2017. Application of data mining algorithms to appreciate sensitivity and spatial zoning prone to floating view in Khorasan Razavi Display Basins. Journal of Environmental Erosion Research, 7(26): 16-42.
|
|
|
| [4] |
Baddock M C, Gill T E, Bullard J E, et al. 2011. Geomorphology of the Chihuahuan Desert based on potential dust emissions. Journal of Maps, 7(1): 249-259.
doi: 10.4113/jom.2011.1178
|
|
|
| [5] |
Behrooz R D, Esmaili-Sari A, Bahramifar N, et al. 2017. Trace-element concentrations and water-soluble ions in size-segregated dustborne and soil samples in Sistan, southeast Iran. Aeolian Resarch, 25: 87-105.
|
|
|
| [6] |
Behrooz R D, Kaskaoutis D G, Grivas G, et al. 2021. Human health risk assessment for toxic elements in the extreme ambient dust conditions observed in Sistan, Iran. Chemosphere, 262: 127835, doi: 10.1016/j.chemosphere.2020.127835.
doi: 10.1016/j.chemosphere.2020.127835
|
|
|
| [7] |
Bilal M, Nichol J E, Chan P W. 2014. Validation and accuracy assessment of a Simplified Aerosol Retrieval Algorithm (SARA) over Beijing under low and high aerosol loadings and dust storms. Remote Sensing of Environment, 153: 50-60.
doi: 10.1016/j.rse.2014.07.015
|
|
|
| [8] |
Boloorani A D, Papi R, Soleimani M, et al. 2021. Water bodies changes in Tigris and Euphrates basin has impacted dust storms phenomena. Aeolian Research, 50: 100698, doi: 10.1016/j.aeolia.2021.100698.
doi: 10.1016/j.aeolia.2021.100698
|
|
|
| [9] |
Bonham-Carter G F. 1994. Geographic information systems for geoscientists: modelling with GIS. Computer Methods in the Geoscientists, 13: 398.
|
|
|
| [10] |
Boroughani M, Hashemi H, Hosseini S H, et al. 2019. Desiccating Lake Urmia: a new dust source of regional importance. IEEE Geoscience and Remote Sensing Letters, 17(9): 1483-1487.
doi: 10.1109/LGRS.8859
|
|
|
| [11] |
Boroughani M. 2020. Identification of dust source area in Sistan basin and determination of their characteristics. Iranian Journal of Range and Desert Research, 27: 617-631.
|
|
|
| [12] |
Boroughani M, Pourhashemi S, Hashemi H, et al. 2020. Application of remote sensing techniques and machine learning algorithms in dust source detection and dust source susceptibility mapping. Ecological Informatics, 56: 101059.
doi: 10.1016/j.ecoinf.2020.101059
|
|
|
| [13] |
Cao H, Amiraslani F, Liu J, et al. 2015. Identification of dust storm source areas in West Asia using multiple environmental datasets. Science of the Total Environment, 502: 224-235.
doi: 10.1016/j.scitotenv.2014.09.025
|
|
|
| [14] |
Chen X, Chen H, You Y, et al. 2015. Susceptibility assessment of debris flows using the analytic hierarchy process method-A case study in Subao river valley, China. Journal of Rock Mechanics and Geotechnical Engineering, 7(4): 404-410.
doi: 10.1016/j.jrmge.2015.04.003
|
|
|
| [15] |
Crouvi O, Schepanski K, Amit R, et al. 2012. Multiple dust sources in the Sahara Desert: The importance of sand dunes. Geophysical Research Letters, 39(13): L13401, doi: 10.1029/2012GL052145.
doi: 10.1029/2012GL052145
|
|
|
| [16] |
Dawelbait M, Morari F. 2012. Monitoring desertification in a Savannah region in Sudan using Landsat images and spectral mixture analysis. Journal of Arid Environments, 80: 45-55.
doi: 10.1016/j.jaridenv.2011.12.011
|
|
|
| [17] |
Dube F, Nhapi I, Murwira A, et al. 2014. Potential of weight of evidence modelling for gully erosion hazard assessment in Mbire District-Zimbabwe. Physics and Chemistry of the Earth, 67-69: 145-152.
|
|
|
| [18] |
Ebrahimi-Khusfi Z, Nafarzadegan A R, Dargahian F. 2021. Predicting the number of dusty days around the desert wetlands in southeastern Iran using feature selection and machine learning techniques. Ecological Indicators, 125: 107499, doi: 10.1016/j.ecolind.2021.107499.
doi: 10.1016/j.ecolind.2021.107499
|
|
|
| [19] |
Emamian A, Rashki A, Kaskaoutis D G, et al. 2021. Assessing vegetation restoration potential under different land uses and climatic classes in northeast Iran. Ecological Indicators, 122: 107325, doi: 10.1016/j.ecolind.2020.107325.
doi: 10.1016/j.ecolind.2020.107325
|
|
|
| [20] |
Engelstaedter S, Tegen I, Washington R. 2006. North African dust emissions and transport. Earth Science Review, 79(1-2): 73-100.
doi: 10.1016/j.earscirev.2006.06.004
|
|
|
| [21] |
Evenstar L A, Sparks R S J, Cooper F J, et al. 2018. Quaternary landscape evolution of the Helmand Basin, Afghanistan: Insights from staircase terraces, deltas, and paleoshorelines using high-resolution remote sensing analysis. Geomorphology, 311: 37-50.
doi: 10.1016/j.geomorph.2018.03.018
|
|
|
| [22] |
Floyd K W, Gill T E. 2011. The association of land cover with aeolian sediment production at Jornada Basin, New Mexico, USA. Aeolian Research, 3(1): 55-66.
|
|
|
| [23] |
Francis D, Alshamsi N, Cuesta J, et al. 2019. Cyclogenesis and density currents in the Middle East and the associated dust activity in September 2015. Geosciences, 9: 376.
doi: 10.3390/geosciences9090376
|
|
|
| [24] |
Francis D, Chaboureau J P, Nelli N, et al. 2021. Summertime dust storms over the Arabian Peninsula and impacts on radiation, circulation, cloud development and rain. Atmospheric Research. 250: 105364, doi: 10.1016/j.atmosres.2020.105364.
doi: 10.1016/j.atmosres.2020.105364
|
|
|
| [25] |
Gholami H, Mohamadifar A, Collins A L. 2020a. Spatial mapping of the provenance of storm dust: Application of data mining and ensemble modelling. Atmospheric Research, 233: 104716, doi: 10.1016/j.atmosres.2019.104716.
doi: 10.1016/j.atmosres.2019.104716
|
|
|
| [26] |
Gholami H, Mohammadifar A, Pourghasemi H R, et al. 2020b. A new integrated data mining model to map spatial variation in the susceptibility of land to act as a source of aeolian dust. Environmental Science and Pollution Research, 27(33): 42022-42039.
doi: 10.1007/s11356-020-10168-6
|
|
|
| [27] |
Gholami H, Mohamadifar A, Sorooshian A, et al. 2020c. Machine-learning algorithms for predicting land susceptibility to dust emissions: The case of the Jazmurian Basin, Iran. Atmospheric Pollution Research, 11(8): 1303-1315.
doi: 10.1016/j.apr.2020.05.009
|
|
|
| [28] |
Goossens D, Buck B. 2014. Dynamics of dust clouds produced by off-road vehicle driving. Journal of Earth Sciences and Geotechnical Engineering, 4(2): 1-21.
|
|
|
| [29] |
Hamidianpour M, Jahanshahi S M A, Kaskaoutis D G, et al. 2021. Climatology of the Sistan Levar wind: Atmospheric dynamics driving its onset, duration and withdrawal. Atmospheric Research, 260: 105711, doi: 10.1016/j.atmosres.2021. 105711.
doi: 10.1016/j.atmosres.2021. 105711
|
|
|
| [30] |
Hao J, Ma C, Gao C, et al. 2007. Pseudomonas stutzeri as a novel biocatalyst for pyruvate production from DL-lactate. Biotechnology Letters, 29(1): 105-110.
doi: 10.1007/s10529-006-9204-6
|
|
|
| [31] |
Indoitu R, Orlovsky L, Orlovsky N. 2012. Dust storms in Central Asia: Spatial and temporal variations. Journal of Arid Environment, 85: 62-70.
doi: 10.1016/j.jaridenv.2012.03.018
|
|
|
| [32] |
Javan S, Rahdar S, Miri M, et al. 2021. Modeling of the PM10 pollutant health effects in a semi-arid area: a case study in Zabol, Iran. Modeling Earth Systems and Environment, 7: 455-463.
doi: 10.1007/s40808-020-00874-y
|
|
|
| [33] |
Jewell P W, Nicoll K. 2011. Wind regimes and aeolian transport in the Great Basin, U.S.A. Geomorphology, 129(1-2): 1-13.
|
|
|
| [34] |
Jiao P, Wang J, Chen X, et al. 2021. Next-generation remote sensing and prediction of sand and dust storms: State-of-the-art and future trends. International Journal of Remote Sensing, 42(14): 5281-5320.
|
|
|
| [35] |
Kaskaoutis D G, Rashki A, Houssos E E, et al. 2015. Meteorological aspects associated with dust storms in the Sistan region, southeastern Iran. Climate Dynamics, 45(1-2): 407-424.
doi: 10.1007/s00382-014-2208-3
|
|
|
| [36] |
Kaskaoutis D G, Houssos E E, Rashki A, et al. 2016. The Caspian Sea-Hindu Kush Index (CasHKI): a regulatory factor for dust activity over southwest Asia. Glob Planet Change, 137: 10-23.
doi: 10.1016/j.gloplacha.2015.12.011
|
|
|
| [37] |
Kaskaoutis D G, Houssos E E, Minvielle F, et al. 2018. Long-term variability and trends in the Caspian Sea-Hindu Kush Index: influence on atmospheric circulation patterns, temperature and rainfall over the Middle East and southwest Asia. Global Planet Change, 169: 16-33.
doi: 10.1016/j.gloplacha.2018.07.004
|
|
|
| [38] |
Kharol S K, Kaskaoutis D G, Badarinath K V S, et al. 2013. Influence of land use/land cover (LULC) changes on atmospheric dynamics over the arid region of Rajasthan state, India. Journal of Arid Environment, 88: 90-101.
doi: 10.1016/j.jaridenv.2012.09.006
|
|
|
| [39] |
Klingmüller K, Pozzer A, Metzger S, et al. 2016. Aerosol optical depth trend over the Middle East. Atmospheric Chemical Physics, 16: 5063-5073.
doi: 10.5194/acp-16-5063-2016
|
|
|
| [40] |
Lee J, Shi Y R, Cai C, et al. 2021. Machine learning based algorithms for global dust aerosol detection from satellite images: Inter-comparisons and evaluation. Remote Sensing, 13(3): 456.
doi: 10.3390/rs13030456
|
|
|
| [41] |
Lee J A, Gill T E, Mulligan K R, et al. 2009. Land use/land cover and point sources of the 15 December 2003 dust storm in southwestern North America. Geomorphology, 105(1-2): 18-27.
doi: 10.1016/j.geomorph.2007.12.016
|
|
|
| [42] |
Lee J A, Baddock M C, Mbuh M J, et al. 2012. Geomorphic and land cover characteristics of aeolian dust sources in West Texas and eastern New Mexico, USA. Aeolian Research, 3(4): 459-466.
|
|
|
| [43] |
Lindley T T, Vitale J D, Burgett W S, et al. 2011. Proximity meteorological observations for wind-driven grassland wildfire starts on the southern High Plains. E-Journal of Severe Storms Meteorology, 6(1): 1-27.
|
|
|
| [44] |
Liu D, Abuduwaili J, Lei J, et al. 2011. Deposition rate and chemical composition of the aeolian dust from a bare saline playa, Ebinur Lake, Xinjiang, China. Water, Air, & Soil Pollution, 218(1): 175-184.
|
|
|
| [45] |
Mianabadi H, Alioghli S, Morid S. 2021. Quantitative evaluation of 'No-harm' rule in international transboundary water law in the Helmand River basin. Journal of Hydrology, 599: 126368, doi: 10.1016/j.jhydrol.2021.1.
doi: 10.1016/j.jhydrol.2021.1
|
|
|
| [46] |
Middleton N, Kang U. 2017. Sand and dust storms: Impact mitigation. Sustainability, 9(6): 1053.
doi: 10.3390/su9061053
|
|
|
| [47] |
Middleton N. 2019. Variability and trends in dust storm frequency on decadal timescales: Climatic drivers and human impacts. Geosciences, 9(6): 261, doi: 10.3390/geosciences9060261.
doi: 10.3390/geosciences9060261
|
|
|
| [48] |
Miller M E, Bowker M A, Reynolds R L et al. 2012. Post-fire land treatments and wind erosion-lessons from the Milford Flat Fire, UT, USA. Aeolian Research, 7: 29-44.
|
|
|
| [49] |
Miller S D. 2003. A consolidated technique for enhancing desert dust storms with MODIS. Geophysical Research Letters, 30(20): 1-4.
|
|
|
| [50] |
Modarres R. 2021. Dust storm frequency change in relation to climate drivers. International Journal of Climatology, 41(S1): E187-E199.
|
|
|
| [51] |
Mohammadifar A, Gholami H, Comino J R, et al. 2021. Assessment of the interpretability of data mining for the spatial modelling of water erosion using game theory. CATENA, 200: 105178, doi: 10.1016/j.catena.2021.105178.
doi: 10.1016/j.catena.2021.105178
|
|
|
| [52] |
Motevalli A, Naghibi S A, Hashemi H, et al. 2019. Inverse method using boosted regression tree and k-nearest neighbor to quantify effects of point and non-point source nitrate pollution in groundwater. Journal of Cleaner Production, 228: 1248-1263.
doi: 10.1016/j.jclepro.2019.04.293
|
|
|
| [53] |
Namdari S, Karimi N, Sorooshian A, et al. 2018. Impacts of climate and synoptic fluctuations on dust storm activity over the Middle East. Atmospheric Environmental, 173: 265-276.
doi: 10.1016/j.atmosenv.2017.11.016
|
|
|
| [54] |
Namdari S, Valizadeh Kamran K, Sorooshian A, et al. 2021. Analysis of some factors related to dust storms occurrence in the Sistan region. Environmental Science and Pollution Research, 28: 45450-45458, doi: 10.1007/s11356-021-13922-6.
doi: 10.1007/s11356-021-13922-6
|
|
|
| [55] |
Nandi A, Shakoor A. 2010. A GIS-based landslide susceptibility evaluation using bivariate and multivariate statistical analyses. Engineering Geology, 110(1-2): 11-20.
doi: 10.1016/j.enggeo.2009.10.001
|
|
|
| [56] |
Notaro M, Yu Y, Kalashnikova O V. 2015. Regime shift in Arabian dust activity, triggered by persistent Fertile Crescent drought. Journal of Geophysics Research, 120(19): 10229-10249, doi: 10.1002/2015JD023855.
doi: 10.1002/2015JD023855
|
|
|
| [57] |
Parajuli S P, Zender C S. 2017. Connecting geomorphology to dust emission through high-resolution mapping of global land cover and sediment supply. Aeolian Research, 27: 47-65.
doi: 10.1016/j.aeolia.2017.06.002
|
|
|
| [58] |
Park S S, Kim J, Lee J, et al. 2014. Combined dust detection algorithm by using MODIS infrared channels over East Asia. Remote Sensing of Environment, 141: 24-39.
doi: 10.1016/j.rse.2013.09.019
|
|
|
| [59] |
Qu J J, Hao X, Kafatos M, et al. 2006. Asian dust storm monitoring combining Terra and Aqua MODIS SRB measurements. IEEE Geoscience and Remote Sensing Letters, 3(4): 484-486.
doi: 10.1109/LGRS.2006.877752
|
|
|
| [60] |
Rashki A, Eriksson P G, Rautenbach C D W, et al. 2013. Assessment of chemical and mineralogical characteristics of airborne dust in the Sistan region, Iran. Chemosphere, 90(2): 227-236.
doi: 10.1016/j.chemosphere.2012.06.059
pmid: 22835867
|
|
|
| [61] |
Rashki A, Kaskaoutis D G, Sepehr A. 2018. Statistical evaluation of the dust events at selected stations in southwest Asia: from the Caspian Sea to the Arabian Sea. CATENA, 165: 590-603.
doi: 10.1016/j.catena.2018.03.011
|
|
|
| [62] |
Raspanti G A, Hashibe M, Siwakoti B, et al. 2016. Household air pollution and lung cancer risk among never-smokers in Nepal. Environmental Research, 147: 141-145.
doi: 10.1016/j.envres.2016.02.008
pmid: 26874046
|
|
|
| [63] |
Sankey J B, Wallace C S, Ravi S. 2013. Phenology-based, remote sensing of post-burn disturbance windows in rangelands. Ecological Indicators, 30: 35-44.
doi: 10.1016/j.ecolind.2013.02.004
|
|
|
| [64] |
Schepanski K, Tegen I, Macke A. 2012. Comparison of satellite based observations of Saharan dust source areas. Remote Sensing of Environment, 123: 90-97.
doi: 10.1016/j.rse.2012.03.019
|
|
|
| [65] |
Shaheen A, Wu R, Aldabash M. 2020. Long-term AOD trend assessment over the Eastern Mediterranean region: A comparative study including a new merged aerosol product. Atmospheric Environmental, 117736, doi: 10.1016/j.atmosenv.2020.117736.
doi: 10.1016/j.atmosenv.2020.117736
|
|
|
| [66] |
Shapley L. S. 2016. 17. A Value for N-person Games. Princeton: Princeton University Press, 307-318
|
|
|
| [67] |
Shahsavani A, Tobías A, Querol X, et al. 2020. Short-term effects of particulate matter during desert and non-desert dust days on mortality in Iran. Environment International, 134: 105299, doi: 10.1016/j.envint.2019.105299.
doi: 10.1016/j.envint.2019.105299
|
|
|
| [68] |
Sissakian V K, Al-Ansari N, Knutsson S. 2013. Sand and dust storm events in Iraq. Natural Science, 5(10): 1084-1094.
doi: 10.4236/ns.2013.510133
|
|
|
| [69] |
Soltani N, Keshavarzi B, Moore F, et al. 2015. Ecological and human health hazards of heavy metals and polycyclic aromatic hydrocarbons (PAHs) in road dust of Isfahan metropolis, Iran. Science Total Environmental, 505: 712-723.
doi: 10.1016/j.scitotenv.2014.09.097
|
|
|
| [70] |
Soni M, Payra S, Verma S. 2018. Particulate matter estimation over a semi-arid region Jaipur, India using satellite AOD and meteorological parameters. Atmospheric Pollution Research, 9(5): 949-958.
doi: 10.1016/j.apr.2018.03.001
|
|
|
| [71] |
Stafoggia M, Zauli-Sajani S, Pey J, et al. 2016. Desert dust outbreaks in Southern Europe: Contribution to daily PM10 concentrations and shortterm associations with mortality and hospital admissions. Environmental Health Perspectives, 124: 413-419.
doi: 10.1289/ehp.1409164
pmid: 26219103
|
|
|
| [72] |
Suresh K, Singh U, Kumar A, et al. 2021. Provenance tracing of long-range transported dust over the Northeastern Arabian Sea during the southwest monsoon. Atmospheric Research, 250: 105377, doi: 10.1016/j.atmosres.2020.105377.
doi: 10.1016/j.atmosres.2020.105377
|
|
|
| [73] |
Vickery K J, Eckardt F D. 2013. Dust emission controls on the lower Kuiseb River valley, Central Namib. Aeolian Research, 10: 125-133.
doi: 10.1016/j.aeolia.2013.02.006
|
|
|
| [74] |
Walker A L, Liu M, Miller S D, et al. 2009. Development of a dust source database for mesoscale forecasting in southwest Asia. Journal of Geophysical Research: Atmospheres, 114, D18207, doi: 10.1029/2008JD011541.
doi: 10.1029/2008JD011541
|
|
|
| [75] |
Yesilnacar E K. 2005. The application of computational intelligence to landslide susceptibility mapping in Turkey. PhD Thesis. Melbourne: University of Melbourne.
|
|
|
| [76] |
Yilmaz I. 2009. Landslide susceptibility mapping using frequency ratio, logistic regression, artificial neural networks and their comparison: a case study from Kat landslides (Tokat-Turkey). Computers & Geosciences, 35(6): 1125-1138.
doi: 10.1016/j.cageo.2008.08.007
|
|
|
| [77] |
Yu Y, Notaro M, Kalashnikova O V, et al. 2016. Climatology of summer Shamal wind in the Middle East. Journal of Geophysics Research, 121(1): 289-305, doi: 10.1002/2015JD024063.
doi: 10.1002/2015JD024063
|
|
|
| [78] |
Yu Y, Notaro M, Liu Z, et al. 2015. Climatic controls on the interannual to decadal variability in Saudi Arabian dust activity: toward the development of a seasonal dust prediction model. Journal of Geophysics Research, 120(5): 1739-1758.
|
|
|
| [79] |
Zhang X, Kang T, Wang H, et al. 2010. Analysis on spatial structure of land use change based on remote sensing and geographical information system. International Journal of Applied Earth Observation and Geoinformation, 12(S2): S145-S150.
|
|
|
| [80] |
Zobeck T M, Baddock M, van Pelt R S, et al. 2013. Soil property effects on wind erosion of organic soils. Aeolian Research, 10: 43-51.
doi: 10.1016/j.aeolia.2012.10.005
|
|
|
|
Viewed |
|
|
|
Full text
|
|
|
|
|
Abstract
|
|
|
|
|
Cited |
|
|
|
|
| |
Shared |
|
|
|
|
| |
Discussed |
|
|
|
|