| Research article |
|


|
|
|
| Land degradation sensitivity assessment and convergence analysis in Korla of Xinjiang, China |
Jinchen DING, Yunzhi CHEN*( ), Xiaoqin WANG, Meiqin CAO ), Xiaoqin WANG, Meiqin CAO |
| Key Laboratory of Spatial Data Mining and Information Sharing of Ministry of Education, National & Local Joint Engineering Research Center of Satellite Geospatial Information Technology, Fuzhou University, Fuzhou 350108, China |
|
|
|
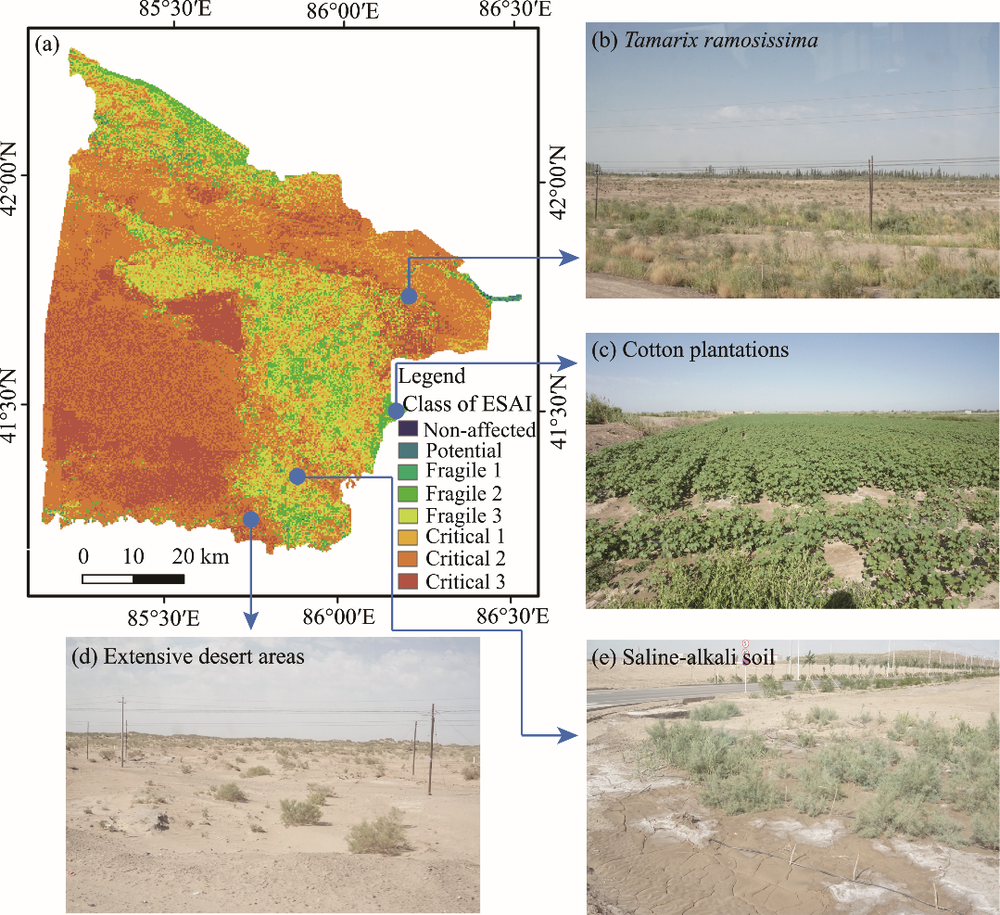
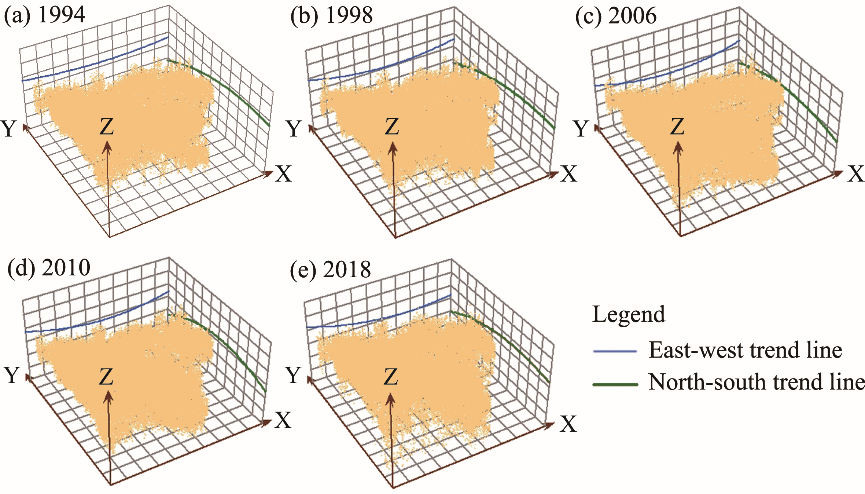
Abstract Land degradation has a major impact on environmental and socio-economic sustainability. Scientific methods are necessary to monitor the risk of land degradation. In this study, the environmental sensitive area index (ESAI) was utilized to assess land degradation sensitivity and convergence analysis in Korla, a typical oasis city in Xinjiang of China, which is located on the northeast border of the Tarim Basin. A total of 18 indicators depicting soil, climate, vegetation, and management qualities were used to illustrate spatial-temporal patterns of land degradation sensitivity from 1994 to 2018. We investigated the causes of spatial convergence and divergence based on the Ordinary Least Squares (OLS) and Geographically Weighted Regression (GWR) models. The results show that the branch of the Tianshan Mountains and oasis plain had a low sensitivity to land degradation, while the Tarim Basin had a high risk of land degradation. More than two-thirds of the study area can be categorized as "critical" sensitivity classes. The largest percentage (32.6%) of fragile classes was observed for 2006. There was no significant change in insensitive or low-sensitivity areas, which accounted for less than 0.4% of the entire observation period. The ESAI of the four time periods (1994-1998, 1998-2006, 2006-2010, and 2010-2018) formed a series of convergence patterns. The convergence patterns of 1994-1998 and 1998-2006 can be explained by the government's efforts to "Returning Farmland to Forests" and other governance projects. In 2006-2010, the construction of afforested work intensified, but industrial development and human activities affected the convergence pattern. The pattern of convergence in most regions between 2010 and 2018 can be attributed to the government's implementation of a series of key ecological protection projects, which led to a decrease in sensitivity to land degradation. The results of this study altogether suggest that the ESAI convergence analysis is an effective early warning method for land degradation sensitivity.
|
|
Received: 08 August 2019
Published: 10 July 2020
|
|
Corresponding Authors:
|
| About author: *Corresponding author: CHEN Yunzhi (E-mail: chenyunzhi@fzu.edu.cn) |
|
|
| [1] |
Abasi G, Kasimu A. 2015. Analysis on correlation between cultivated land resources and urbanization development in Korla City. Research of Soil and Water Conservation, 22(4): 305-309. (in Chinese)
|
|
|
| [2] |
Abu H A, Tumeizi A. 2012. Land degradation: Socioeconomic and environmental causes and consequences in the eastern Mediterranean. Land Degradation and Development, 23(3): 216-226.
doi: 10.1002/ldr.v23.3
|
|
|
| [3] |
Afendras G, Markatou M. 2016. Uniform integrability of the OLS estimators, and the convergence of their moments. TEST, 25(4): 775-784.
doi: 10.1007/s11749-016-0498-y
|
|
|
| [4] |
Aizezi A, Wang Y, Huang S W. 2014. Ecological security evaluation of resource-based cities in South Xinjiang: A case study of Korla City. Journal of Anhui Agricultural Sciences, 42(30): 10693-10697. (in Chinese)
|
|
|
| [5] |
Basso B, De S L, Cammarano D, et al. 2012. Evaluating responses to land degradation mitigation measures in southern Italy. International Journal of Environmental Research, 6(2): 367-380.
|
|
|
| [6] |
Basso F, Bove E, Dumontet S, et al. 2000. Evaluating environmental sensitivity at the basin scale through the use of geographic information systems and remotely sensed data: An example covering the Agri basin (southern Italy). Catena, 40(1): 19-35.
|
|
|
| [7] |
Brunsdon C, Fotheringham A S, Charlton M E. 1996. Geographically weighted regression: A method for exploring spatial nonstationarity. Geographical Analysis, 28(4): 281-298.
|
|
|
| [8] |
Cai Z Z, An S Z, Pu Z, et al. 2015. A study on vegetation coverage change in Korla City based on the TM NDVI. Pratacultural Science, 32(7): 1069-1078. (in Chinese)
|
|
|
| [9] |
Contador J F L, Schnabel S, Gutierrez A G, et al. 2009. Mapping sensitivity to land degradation in extremadura. SW Spain. Land Degradation and Development, 20(2): 129-144.
|
|
|
| [10] |
Dubovyk O. 2017. The role of Remote Sensing in land degradation assessments: Opportunities and challenges. European Journal of Remote Sensing, 50(1): 601-613.
|
|
|
| [11] |
Easdale M H, Farina C, Hara S, et al. 2019. Trend-cycles of vegetation dynamics as a tool for land degradation assessment and monitoring. Ecological Indicators, 107: 105545, doi: 10.1016/j.ecolind.2019.105545.
|
|
|
| [12] |
Emin M, Simayi Z. 2014. Coupling analysis of urbanization process to ecological environment of Korla City. Arid Land Geography, 37(1): 188-194. (in Chinese)
|
|
|
| [13] |
Gibbs H K, Salmon J M. 2015. Mapping the world's degraded lands. Applied Geography, 57: 12-21.
|
|
|
| [14] |
Gugler K, Pfaffermayr M. 2004. Convergence in structure and productivity in European Manufacturing? German Economic Review, 5(1): 61-79.
|
|
|
| [15] |
Horion S, Ivits E, De K W, et al. 2019. Mapping European ecosystem change types in response to land-use change, extreme climate events, and land degradation. Land Degradation and Development, 30(8): 951-963.
|
|
|
| [16] |
Jiang L L, Bao A M, Jiapaer G, et al. 2019. Monitoring land sensitivity to desertification in Central Asia: Convergence or divergence? Science of the Total Environment, 658: 669-683.
doi: 10.1016/j.scitotenv.2018.12.152
pmid: 30580221
|
|
|
| [17] |
Kolios S, Mitrakos S, Stylios C. 2018. Detection of areas susceptible to land degradation in Cyprus using remote sensed data and environmental quality indices. Land Degradation and Development, 29(8): 2338-2350.
|
|
|
| [18] |
Kosmas C, Ferrara A, Briassouli H, et al. 1999. Methodology for Mapping Environmentally Sensitive Areas (ESAs) to desertification. Strasbourg: European Commission-Office for Official Publications of the European Communities, 1-87.
|
|
|
| [19] |
Kosmas C, Tsara M, Moustakas N, et al. 2003. Identification of indicators for desertification. Annals of Arid Zone, 42(3): 393-416.
|
|
|
| [20] |
Kosmas C, Kairis O, Karavitis C, et al. 2014. Evaluation and selection of indicators for land degradation and desertification monitoring: Methodological approach. Environmental Management, 54(5): 951-970.
doi: 10.1007/s00267-013-0109-6
pmid: 23797485
|
|
|
| [21] |
Kramer W, Donninger C. 1987. Spatial autocorrelation among errors and the relative efficiency of OLS in the linear regression model. Journal of the American Statistical Association, 82(398): 577-579.
|
|
|
| [22] |
Lamchin M, Lee J Y, Lee W K, et al. 2016. Assessment of land cover change and desertification using remote sensing technology in a local region of Mongolia. Advances in Space Research, 57(1): 64-77.
|
|
|
| [23] |
Li C E. 2018. Spatial-temporal variation of land desertification in Xinjiang. Science of Surveying and Mapping, 43(9): 33-39. (in Chinese)
|
|
|
| [24] |
Li M Y, Liu F, Xu T, et al. 2012. Mining of spatial data of forest resources based on GIS: A case study of Zijin Mountain. Journal of Northwest Forestry University, 27(3): 180-186. (in Chinese)
|
|
|
| [25] |
Liu C X, Wu X L, Wang L. 2019. Analysis on land ecological security change and affect factors using RS and GWR in the Danjiangkou Reservoir area, China. Applied Geography, 105: 1-14.
doi: 10.1016/j.apgeog.2019.02.009
|
|
|
| [26] |
Liu J K, Zhong S Q, Chen Y L, et al. 2014. Study on extracting method of Korla Pear information based on satellite Remote Sensing data. Science Technology and Engineering, 14(26): 190-196. (in Chinese)
|
|
|
| [27] |
Liu Z H, Mcvicar T R, Li L T, et al. 2008. Introduction of the professional interpolation software for meteorology data: ANUSPLINN. Meteorological Monthly, 34(2): 92-100. (in Chinese)
|
|
|
| [28] |
Ma X K, Gao M H. 2017. Dynamic assessment of land ecologic safety of oasis city in arid northwest China: A case of Korla City in Xinjiang. Arid Land Geography, 40(1): 172-180. (in Chinese)
|
|
|
| [29] |
Maimaiti B, Ding J L, Simayi Z, et al. 2017. Characteristics of urban spatial expansion and its driving factors in Korla City. Journal of Glaciology and Geocryology, 39(2): 443-452. (in Chinese)
|
|
|
| [30] |
Manca G, Attaway D F, Waters N. 2014. Program assessment and the EU's agrienvironmental Measure 214: An investigation of the spatial dynamics of agrienvironmental policies in Sardinia, Italy. Applied Geography, 50: 24-30.
doi: 10.1016/j.apgeog.2014.01.014
|
|
|
| [31] |
Mao D H, Wang Z M, Wu B F, et al. 2018. Land degradation and restoration in the arid and semiarid zones of China: Quantified evidence and implications from satellites. Land Degradation and Development, 29(11): 3841-3851.
doi: 10.1002/ldr.3135
|
|
|
| [32] |
McMillen D P. 2004. Geographically weighted regression: The analysis of spatially varying relationships. American Journal of Agricultural Economics, 86(2): 554-556.
doi: 10.1111/ajae.v86.2
|
|
|
| [33] |
Miao L J, Liu Q, He B, et al. 2012. The impact of Korla's urbanization process on regional land use change. Journal of Arid Land Resources and Environment, 26(10): 162-168. (in Chinese)
|
|
|
| [34] |
Neumayer E. 2001. Improvement without convergence: Pressure on the environment in European Union countries. Journal of Common Market Studies, 39(5): 927-937.
doi: 10.1111/jcms.2001.39.issue-5
|
|
|
| [35] |
Ogneva H Y, Pearsall H, Rakshit R. 2009. Concrete evidence & geographically weighted regression: A regional analysis of wealth and the land cover in Massachusetts. Applied Geography, 29(4): 478-487.
doi: 10.1016/j.apgeog.2009.03.001
|
|
|
| [36] |
Prăvălie R, Săvulescu I, Patriche C, et al. 2017. Spatial assessment of land degradation sensitive areas in southwestern Romania using modified MEDALUS method. Catena, 153: 114-130.
doi: 10.1016/j.catena.2017.02.011
|
|
|
| [37] |
Ran Q Y, Li N. 2015. Ecological security assessment based on PSR model: A case study of Xinjiang Uygur Autonomous Region. Ecological Economy, 31(7): 114-117. (in Chinese)
|
|
|
| [38] |
Reynolds J F, Stafford S D M, Lambin E F, et al. 2007. Global desertification: Building a science for dryland development. Science, 316(5826): 847-851.
doi: 10.1126/science.1131634
pmid: 17495163
|
|
|
| [39] |
Riva M J, Daliakopoulos I N, Eckert S, et al. 2017. Assessment of land degradation in Mediterranean forests and grazing lands using a landscape unit approach and the normalized difference vegetation index. Applied Geography, 86: 8-21.
doi: 10.1016/j.apgeog.2017.06.017
|
|
|
| [40] |
Salunkhe S S, Bera A K, Rao S S, et al. 2018. Evaluation of indicators for desertification risk assessment in part of Thar Desert Region of Rajasthan using geospatial techniques. Journal of Earth System Science, 127(8): 1-24.
doi: 10.1007/s12040-017-0916-x
|
|
|
| [41] |
Salvati L, Zitti M. 2008. Regional convergence of environmental variables: Empirical evidences from land degradation. Ecological Economics, 68(1-2): 162-168.
doi: 10.1016/j.ecolecon.2008.02.018
|
|
|
| [42] |
Salvati L, Zitti M. 2009a. Assessing the impact of ecological and economic factors on land degradation vulnerability through multiway analysis. Ecological Indicators, 9(2): 357-363.
doi: 10.1016/j.ecolind.2008.04.001
|
|
|
| [43] |
Salvati L, Zitti M. 2009b. Convergence or divergence in desertification risk? Scale-based assessment and policy implications in a Mediterranean country. Journal of Environmental Planning and Management, 52(7): 957-971.
doi: 10.1080/09640560903181220
|
|
|
| [44] |
Salvati L, Bajocco S, Ceccarelli T, et al. 2011. Towards a process-based evaluation of land vulnerability to soil degradation in Italy. Ecological Indicators, 11(5): 1216-1227.
doi: 10.1016/j.ecolind.2010.12.024
|
|
|
| [45] |
Sommer S, Zucca C, Grainger A, et al. 2011. Application of indicator systems for monitoring and assessment of desertification from national to global scales. Land Degradation and Development, 22(2): 184-197.
doi: 10.1002/ldr.1084
|
|
|
| [46] |
Song G, Wang J S, He L H, et al. 2013. Simulation of land use change in western arid region under different scenarios based on the CLUE-S model. Journal of Nanjing Forestry University (Natural Science Edition), 37(3): 135-139. (in Chinese)
|
|
|
| [47] |
Statistic Bureau of Koral. Statistical Communique of National Economic and Social Development of Koral in 2018. Koral: Statistic Bureau of Koral. [2019-09-13]. http://www.xjkel.gov.cn/gk/shfwl/tjgb/202171.htm.
|
|
|
| [48] |
Tang J C. 1989. The second nationwide general soil survey and the developments in soil and fertilizer sciences. Acta Pedologica Sinica, 26(3): 234-240. (in Chinese)
|
|
|
| [49] |
Tombolini I, Colantoni A, Renzi G, et al. 2016. Lost in convergence, found in vulnerability: A spatially-dynamic model for desertification risk assessment in Mediterranean agro-forest districts. Science of the Total Environment, 569-570: 973-981.
doi: 10.1016/j.scitotenv.2016.06.049
pmid: 27450247
|
|
|
| [50] |
Tu J, Xia Z G. 2008. Examining spatially varying relationships between land use and water quality using geographically weighted regression I: Model design and evaluation. Science of the Total Environment, 407(1): 358-378.
doi: 10.1016/j.scitotenv.2008.09.031
pmid: 18976797
|
|
|
| [51] |
Wang H C, Zuo R G. 2015. A comparative study of trend surface analysis and spectrum-area multifractal model to identify geochemical anomalies. Journal of Geochemical Exploration, 155: 84-90.
doi: 10.1016/j.gexplo.2015.04.013
|
|
|
| [52] |
Wang Q, Ni J, Tenhunen J. 2005. Application of a geographically-weighted regression analysis to estimate net primary production of Chinese forest ecosystems. Global Ecology and Biogeography, 14(4): 379-393.
doi: 10.1111/geb.2005.14.issue-4
|
|
|
| [53] |
Wang W L, Dong Z B, Yan C Z. 2014. Trend analysis on land degradation in Zoige Plateau based on landscape structure methods. Journal of Arid Land Resources and Environment, 28(10): 117-122. (in Chinese)
|
|
|
| [54] |
Weinzierl T, Wehberg J, Boehner J, et al. 2016. Spatial assessment of land degradation risk for the Okavango River Catchment, Southern Africa. Land Degradation and Development, 27(2): 281-294.
doi: 10.1002/ldr.2426
|
|
|
| [55] |
Wilson G A. 1996. Farmer environmental attitudes and ESA participation. Geoforum, 27(2): 115-131.
doi: 10.1016/0016-7185(96)00010-3
|
|
|
| [56] |
Xu D Y, Kang X W, Qiu D S, et al. 2009. Quantitative assessment of desertification using Landsat data on a regional scale: A case study in the Ordos Plateau, China. Sensors, 9(3): 1738-1753.
doi: 10.3390/s90301738
pmid: 22573984
|
|
|
| [57] |
Yan H, Wang Y J, Zhang H L. 2015. Ecological sensitivity of Bayingolin Mongolian Autonomous Prefecture of Xinjiang. Arid Land Geography, 38(6): 1226-1233. (in Chinese)
|
|
|
| [58] |
Zhang Z W, Yang F X, Wu J L, et al. 2014. Spatial distribution patterns and type structure of the deserts in Xinjiang. Arid Zone Research, 31(4): 763-770. (in Chinese)
|
|
|
|
Viewed |
|
|
|
Full text
|
|
|
|
|
Abstract
|
|
|
|
|
Cited |
|
|
|
|
| |
Shared |
|
|
|
|
| |
Discussed |
|
|
|
|