| Research article |
|

|
|
|
| Modeling decadal snow and ice dynamics and their hydrological impacts in the Balkhash Lake Basin, Central Asia |
GAN Guojing1,2,3,4, WU Jinglu1,3,4,*( ), YANG Ruibiao1,3,4, GAO Yanchun5, SHEN Beibei6 ), YANG Ruibiao1,3,4, GAO Yanchun5, SHEN Beibei6 |
1 State Key Laboratory of Lake and Watershed Science for Water Security, Nanjing Institute of Geography and Limnology, Chinese Academy of Sciences, Nanjing 211135, China
2 Key Laboratory of Watershed Geographic Sciences, Chinese Academy of Sciences, Nanjing 211135, China
3 University of Chinese Academy of Sciences, Beijing 100049, China
4 College of Nanjing, University of Chinese Academy of Sciences, Nanjing 211135, China
5 Key Laboratory of Water Cycle and Related Land Surface Processes, Institute of Geographical Sciences and Natural Resources Research, Chinese Academy of Sciences, Beijing 100101, China
6 College of Environmental Science and Engineering, Yangzhou University, Yangzhou 225127, China |
|
|
|
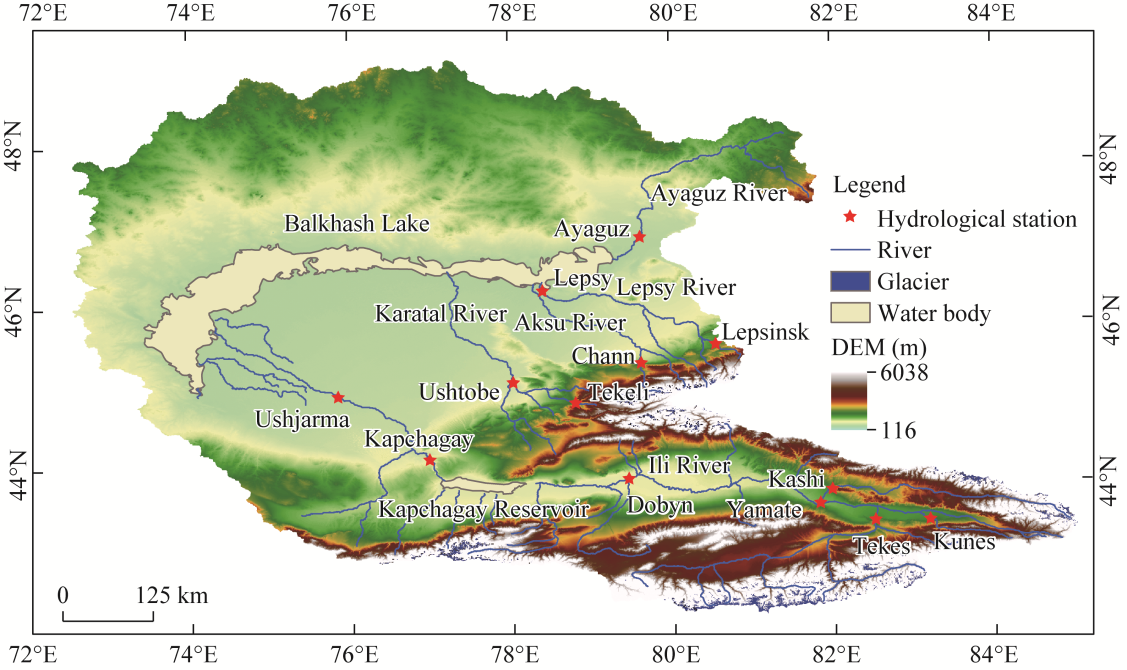
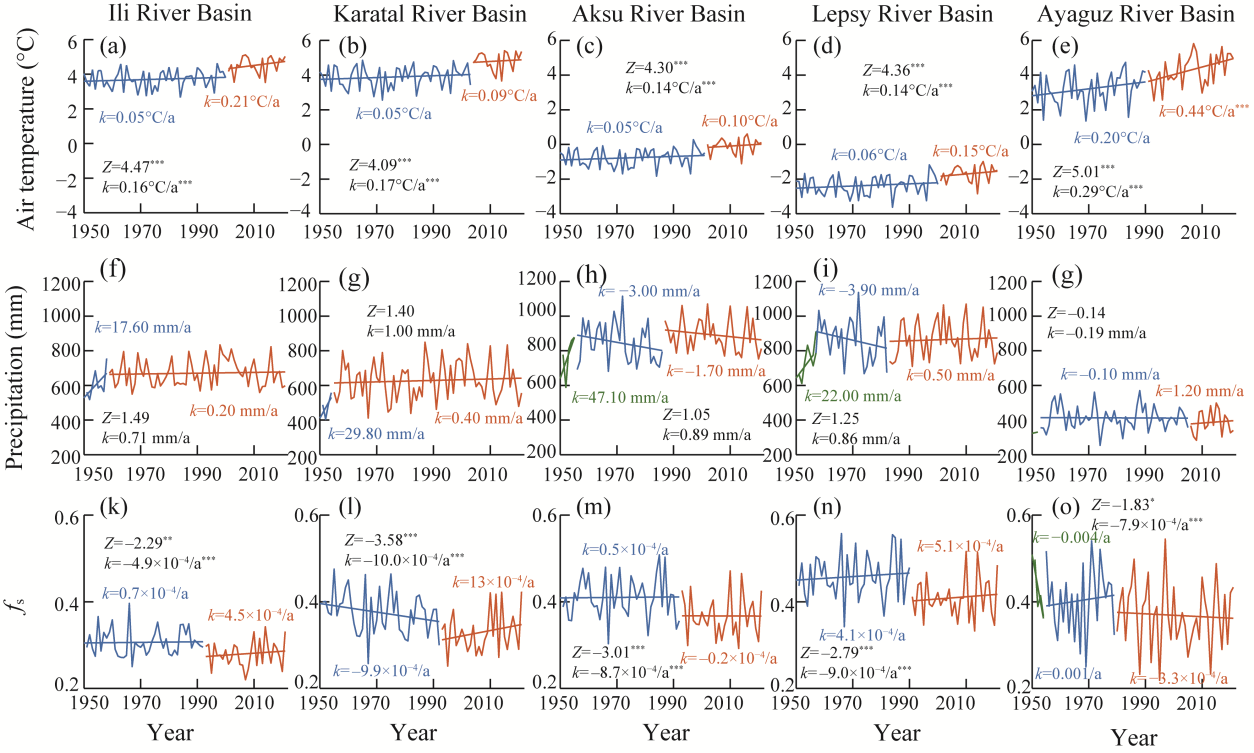
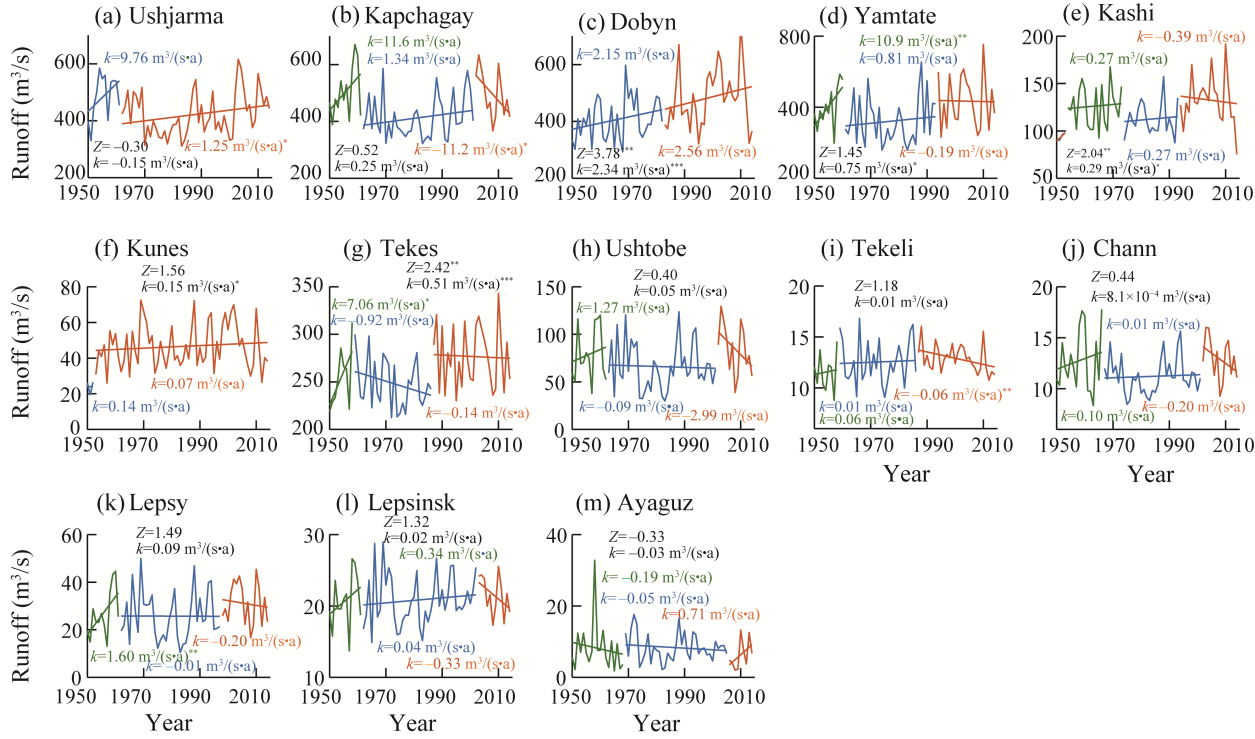
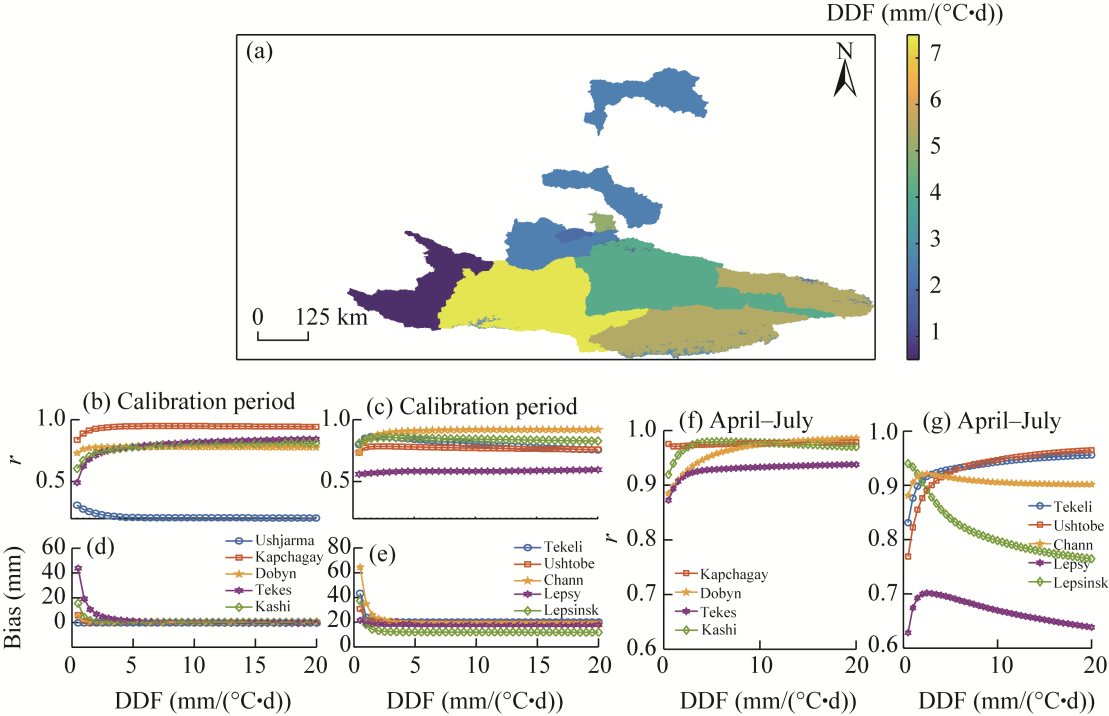
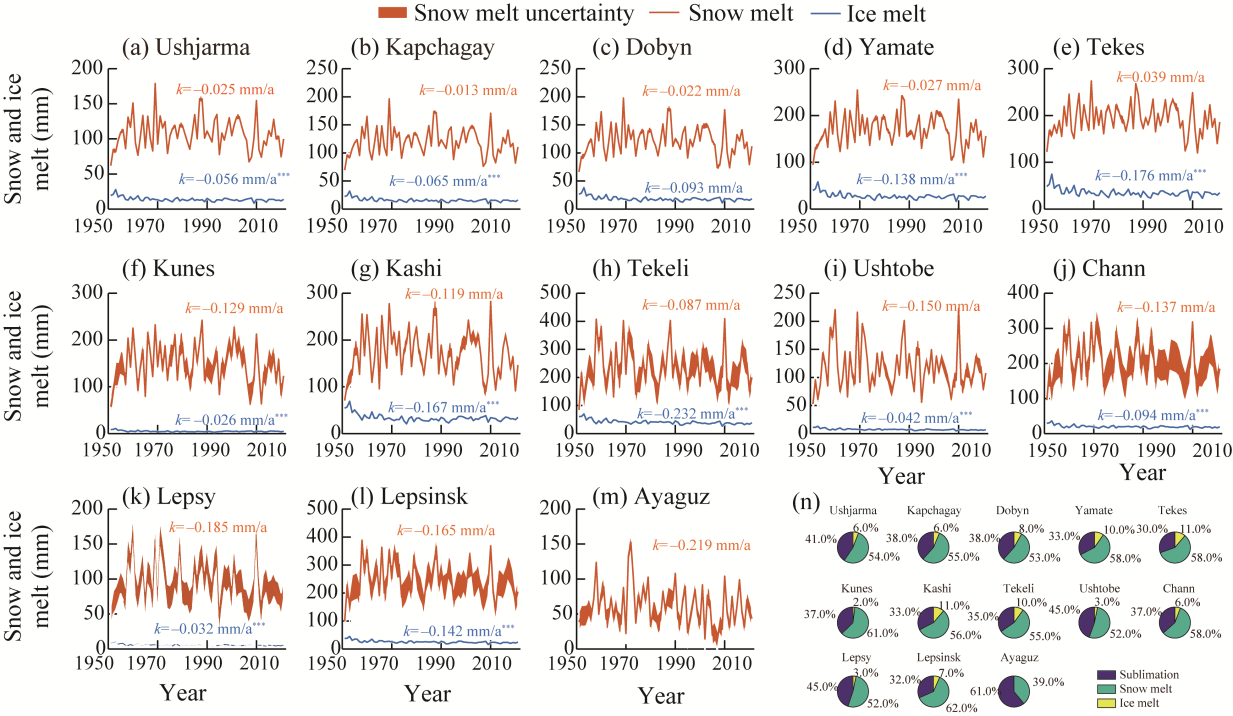
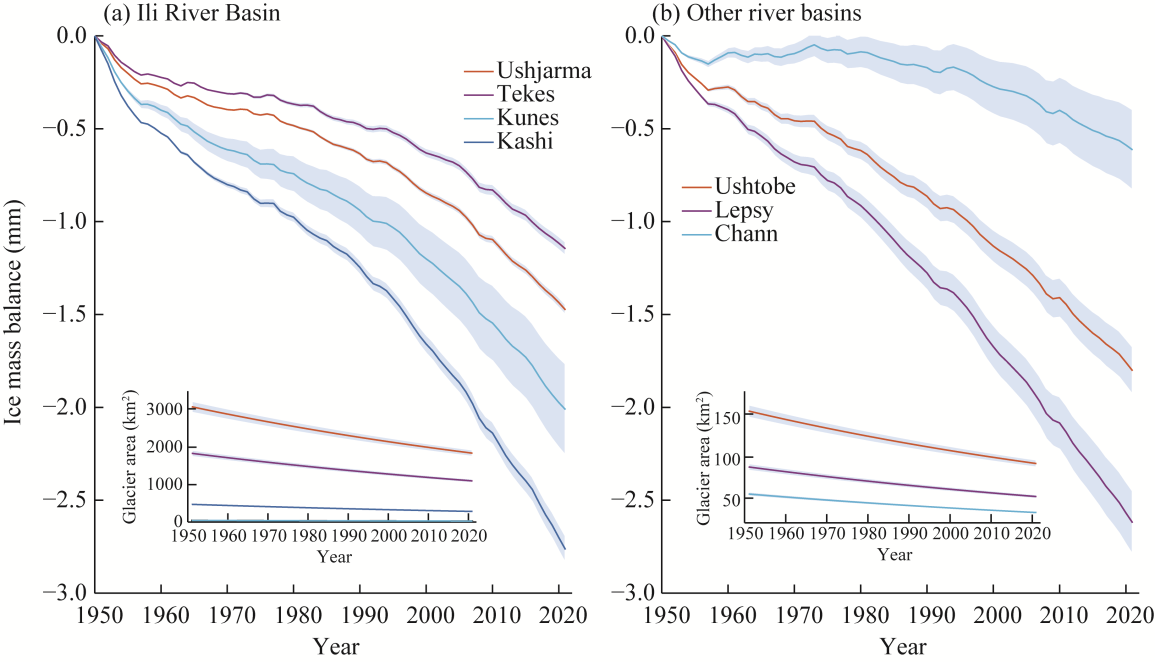
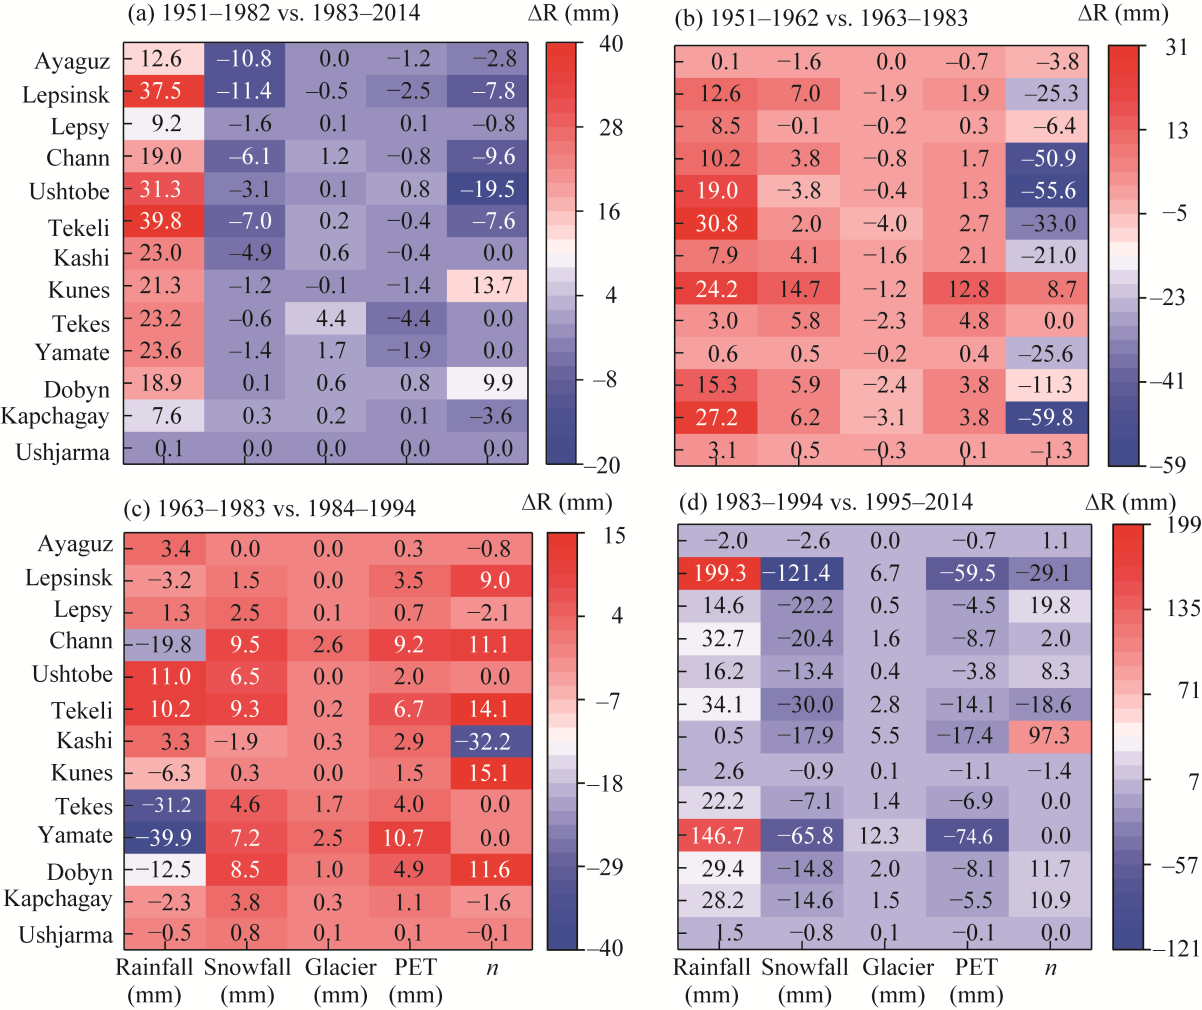
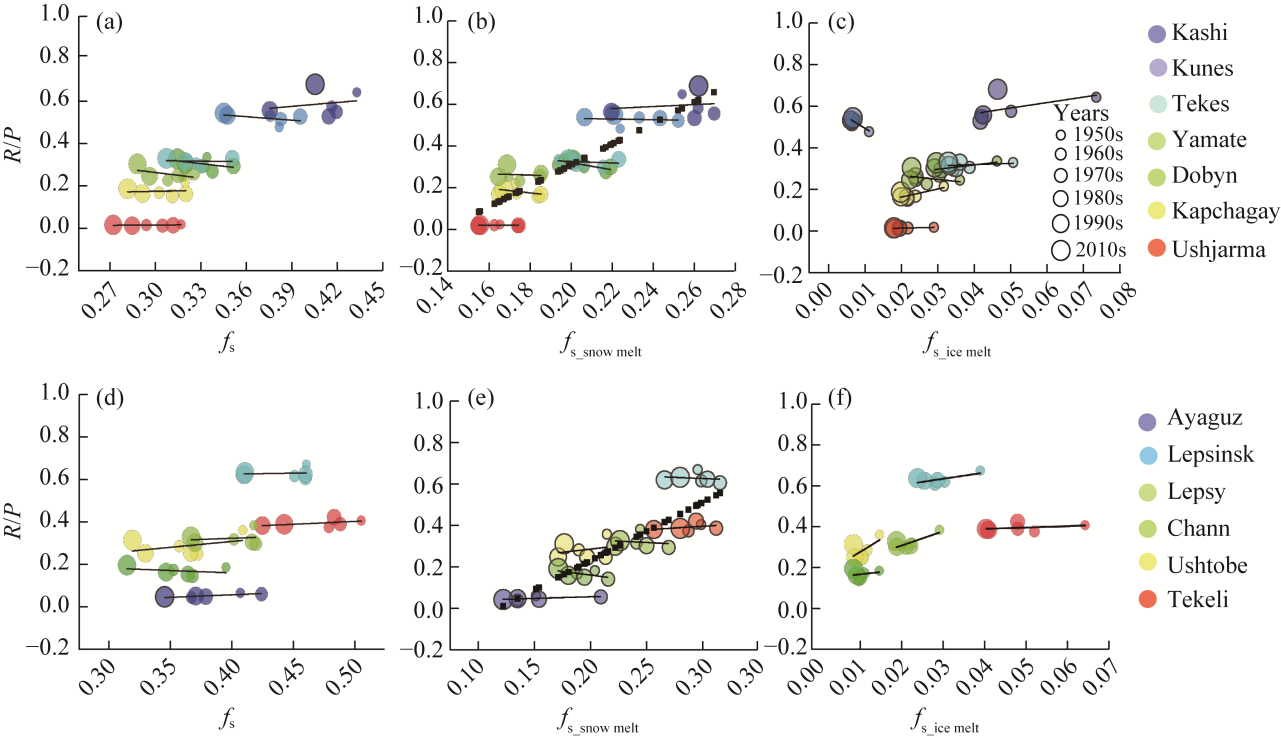
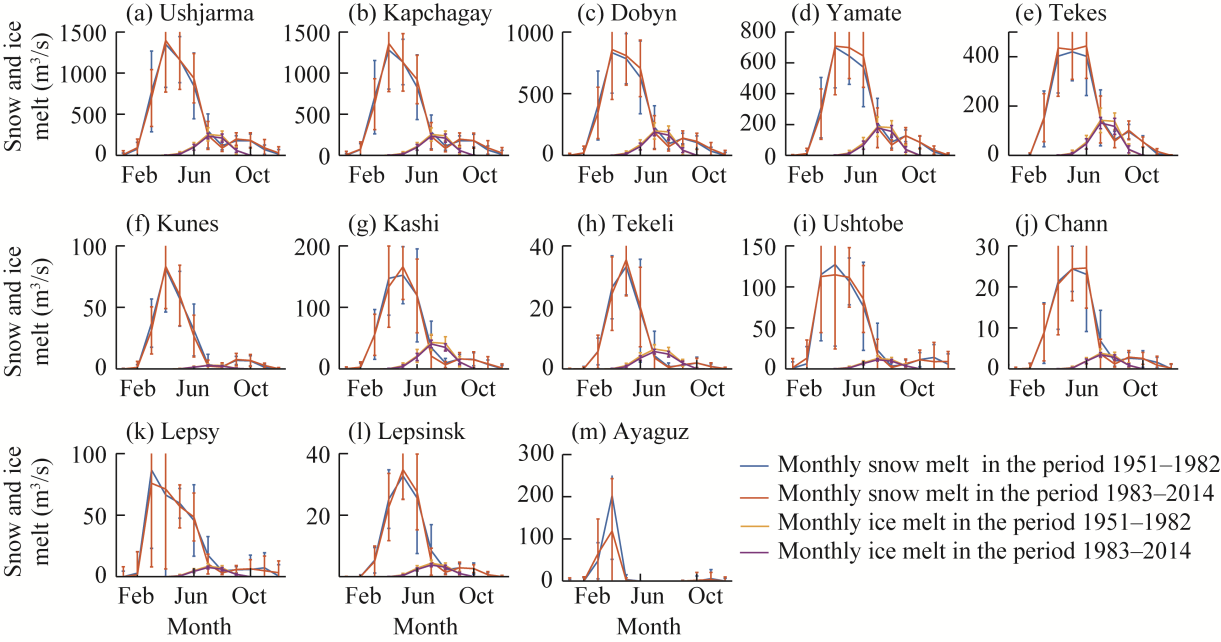
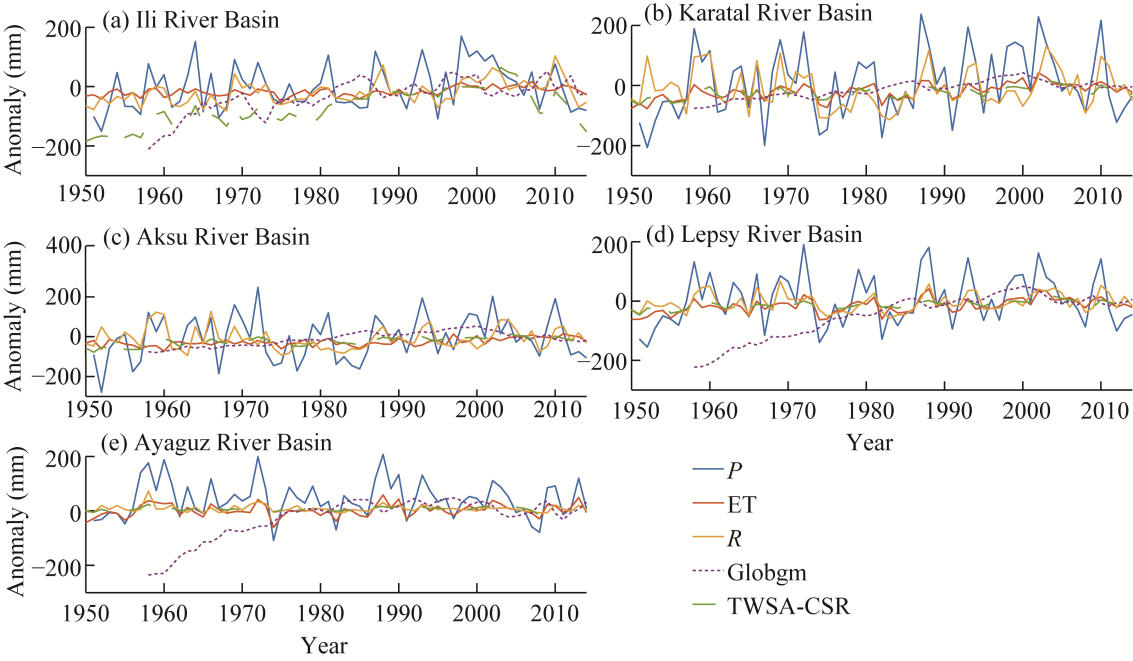
Abstract The Balkhash Lake Basin (BLB), a vital Central Asian watershed, faces hydrological uncertainty under climate warming. This study integrated multi-source remote sensing data (Sentinel-1 snow depth, Randolph Glacier Inventory (RGI) v.7.0 glacier inventory, and Advanced Spaceborne Thermal Emission and Reflection Radiometer (ASTER) mass balance) with a degree-day model to reconstruct decadal snow and ice dynamics across 13 sub-basins and analyzed their hydrological impacts from 1950 to 2014. The results showed that: (1) while flows from the downstream river of the BLB decreased from 1950 to 1982 due to land surface changes, runoff increased significantly after 1982 in the Ili River (18.0%) and moderately increased in most rivers in the east (1.3%-8.3%), driven by increased precipitation and glacier melt. Runoff in the Ayaguz catchment (no glaciers with the highest climate warming) declined (10.5%); (2) climate warming reduced precipitation falling as snow caused snow melt water to decline (0.03-0.22 mm/a) across the BLB, leading to downward shifts in runoff and runoff coefficient, especially in the rivers in the east. However, snow melt during April-June positively correlated with runoff coefficient, contributing to an upward shift in the Ili River Basin; and (3) meltwater from glacierized areas (<5.0% of basin area) contributed to 14.3% of total ablation water. Net glacier melt provided substantial excess flows (11.6 m3/s in the Ili River and <1.0 m3/s in the rivers in the east), generally counterbalancing the negative effect of rising potential evaporation at decadal scales and positively correlating with the runoff coefficient. Therefore, water stress in the BLB may be more severe in the future due to the accelerating glacier melt after the abrupt increase in air temperature in 2000, the continuing decline in snow melt, and the significant inter-annual variations in precipitation.
|
|
Received: 22 June 2025
Published: 30 April 2026
|
|
Corresponding Authors:
*WU Jinglu (E-mail: w.jinglu@niglas.ac.cn)
|
|
|
| [1] |
Ahmad I, Tang D S, Wang T F, et al. 2015. Precipitation trends over time using Mann-Kendall and Spearman's rho tests in Swat River Basin, Pakistan. Advances in Meteorology, 2015: 431860, doi: 10.1155/2015/431860.
|
|
|
| [2] |
Armstrong R L, Rittger K, Brodzik M J, et al. 2019. Runoff from glacier ice and seasonal snow in High Asia: separating meltwater sources in river flow. Regional Environmental Change, 19(5): 1249-1261.
doi: 10.1007/s10113-018-1429-0
|
|
|
| [3] |
Beaudoing H, Rodell M. 2019. GLDAS Noah Land Surface Model L 4 monthly 0.25×0.25 degree, version 2.0. [2025-04-17]. https://doi.org/10.5067/SXAVCZFAQLNO.
|
|
|
| [4] |
Berghuijs W, Woods R A, Hrachowitz M. 2014. A precipitation shift from snow towards rain leads to a decrease in streamflow. Nature Climate Change, 4(7): 583-586.
doi: 10.1038/nclimate2246
|
|
|
| [5] |
Brun F, Berthier E, Wagnon P, et al. 2017. A spatially resolved estimate of High Mountain Asia glacier mass balances from 2000 to 2016. Nature Geoscience, 10(9): 668-673.
doi: 10.1038/ngeo2999
|
|
|
| [6] |
Brutsaert W. 2015. A generalized complementary principle with physical constraints for land-surface evaporation. Water Resources Research, 51(10): 8087-8093.
doi: 10.1002/wrcr.v51.10
|
|
|
| [7] |
Bu J Y, Gan G J, Chen J H, et al. 2021. Biophysical constraints on evapotranspiration partitioning for a conductance-based two source energy balance model. Journal of Hydrology, 603: 127179, doi: 10.1016/j.jhydrol.2021.127179.
|
|
|
| [8] |
Budyko M. 1974. Climate and Life. New York: Academic Press.
|
|
|
| [9] |
Cai M Y, Yang S T, Zeng H J, et al. 2014. A distributed hydrological model driven by multi-source spatial data and its application in the Ili River basin of Central Asia. Water Resources Management, 28(10): 2851-2866.
doi: 10.1007/s11269-014-0641-z
|
|
|
| [10] |
Chen Y N, Li W H, Deng H J, et al. 2016. Changes in Central Asia's water tower: Past, present and future. Scientific Reports, 6: 35458, doi: 10.1038/srep35458.
pmid: 27762285
|
|
|
| [11] |
Choudhury B J. 1999. Evaluation of an empirical equation for annual evaporation using field observations and results from a biophysical model. Journal of Hydrology, 216(1-2): 99-110.
doi: 10.1016/S0022-1694(98)00293-5
|
|
|
| [12] |
Dooge J C I, Bruen M, Parmentier B. 1999. A simple model for estimating the sensitivity of runoff to long-term changes in precipitation without a change in vegetation. Advances in Water Resources, 23(2): 153-163.
doi: 10.1016/S0309-1708(99)00019-6
|
|
|
| [13] |
Duan W L, Zou S, Chen Y N, et al. 2020. Sustainable water management for cross-border resources: The Balkhash Lake Basin of Central Asia, 1931-2015. Journal of Cleaner Production, 263: 121614, doi: 10.1016/j.jclepro.2020.121614.
|
|
|
| [14] |
Farinotti D, Longuevergne L, Moholdt G, et al. 2015. Substantial glacier mass loss in the Tien Shan over the past 50 years. Nature Geoscience, 8(9): 716-722.
doi: 10.1038/NGEO2513
|
|
|
| [15] |
Farinotti D, Huss M, Fürst J, et al. 2019. A consensus estimate for the ice thickness distribution of all glaciers on Earth. Nature Geoscience, 12(3): 168-173.
doi: 10.1038/s41561-019-0300-3
|
|
|
| [16] |
Gan G J, Kang T T, Yang S, et al. 2019a. An optimized two source energy balance model based on complementary concept and canopy conductance. Remote Sensing of Environment, 223: 243-256.
doi: 10.1016/j.rse.2019.01.020
|
|
|
| [17] |
Gan G J, Liu Y B, Pan X, et al. 2019b. Testing the symmetric assumption of complementary relationship: A comparison between the linear and nonlinear advection-aridity models in a large ephemeral lake. Water, 11(8): 1574, doi: 10.3390/w11081574.
|
|
|
| [18] |
Gan G J, Liu Y B, Pan X, et al., 2020. Seasonal and diurnal variations in the Priestley-Taylor coefficient for a large ephemeral lake. Water, 12(3): 849, doi: 10.3390/w12030849.
|
|
|
| [19] |
Gan G J, Liu Y B, Chen D X, et al. 2021a. Investigation of a nonlinear complementary relationship model for monthly evapotranspiration estimation at global flux sites. Journal of Hydrometeorology, 22(10): 2645-2658.
|
|
|
| [20] |
Gan G J, Liu Y B, Sun G. 2021b. Understanding interactions among climate, water, and vegetation with the Budyko framework. Earth Science Reviews, 212: 103451, doi: 10.1016/j.earscirev.2020.103451.
|
|
|
| [21] |
Gan G J, Wu J L, Hori M, et al. 2022. Attribution of decadal runoff changes by considering remotely sensed snow/ice melt and actual evapotranspiration in two contrasting watersheds in the Tienshan Mountains. Journal of Hydrology, 610: 127810, doi: 10.1016/j.jhydrol.2022.127810.
|
|
|
| [22] |
Ghiggi G, Humphrey V, Seneviratne S I, et al. 2019. GRUN: An observation-based global gridded runoff dataset from 1902 to 2014. Earth System Science Data, 11(4): 1655-1674.
doi: 10.5194/essd-11-1655-2019
|
|
|
| [23] |
Gul C Kang, S C, Ghauri B, et al. 2017. Using Landsat images to monitor changes in the snow-covered area of selected glaciers in northern Pakistan. Journal of Mountain Science, 14: 2013-2027.
doi: 10.1007/s11629-016-4097-x
|
|
|
| [24] |
Gul J, Muhammad S, Liu S Y, et al. 2020. Spatio-temporal changes in the six major glaciers of the Chitral River basin (Hindukush Region of Pakistan) between 2001 and 2018. Journal of Mountain Science, 17: 572-587.
doi: 10.1007/s11629-019-5728-9
|
|
|
| [25] |
Hamed K H. 2008. Trend detection in hydrologic data: The Mann-Kendall trend test under the scaling hypothesis. Journal of Hydrology, 349(3-4): 350-363.
doi: 10.1016/j.jhydrol.2007.11.009
|
|
|
| [26] |
Hock R. 2003. Temperature index melt modelling in mountain areas. Journal of Hydrology, 282(1-4): 104-115.
doi: 10.1016/S0022-1694(03)00257-9
|
|
|
| [27] |
Hu Y N, Duan W L, Chen Y N, et al. 2021. An integrated assessment of runoff dynamics in the Amu Darya River Basin: Confronting climate change and multiple human activities, 1960-2017. Journal of Hydrology, 603: 126905, doi: 10.1016/j.jhydrol.2021.126905.
|
|
|
| [28] |
Jackson M, Azam M F, Baral P, et al. 2023. Consequences of climate change for the cryosphere in the Hindu Kush Himalaya. In: Wester P, Chaudhary S, Chettri N, et al. Water, Ice, Society, and Ecosystems in the Hindu Kush Himalaya: An Outlook. Nepal: International Centre for Integrated Mountain Development (ICIMOD), 17-71.
|
|
|
| [29] |
Jarvis A, Reuter H I, Nelson A, et al. 2008. Hole-filled SRTM for the globe Version 4. CGIAR Consortium for Spatial Information. [2025-03-09]. http://srtm.csi.cgiar.org/.
|
|
|
| [30] |
Jiang L M, Yang J W, Zhang C, et al. 2022. Daily snow water equivalent product with SMMR, SSM/I and SSMIS from 1980 to 2020 over China. Big Earth Data, 6(4): 420-434.
|
|
|
| [31] |
Kapitsa V, Shahgedanova M, Severskiy I, et al. 2020. Assessment of changes in mass balance of the Tuyuksu Group of Glaciers, Northern Tien Shan, between 1958 and 2016 using ground-based observations and Pléiades satellite imagery. Frontiers in Earth Science, 8: 259, doi: 10.3389/feart.2020.00259.
|
|
|
| [32] |
Kayastha R B, Ageta Y, Nakawo M, et al. 2003. Positive degree-day factors for ice ablation on four glaciers in the Nepalese Himalayas and Qinghai-Tibetan Plateau. Bulletin of Glaciological Research, 20: 7-14.
|
|
|
| [33] |
Kendall M G. 1948. Rank Correlation Methods. Oxford: Charles Griffin and Co.
|
|
|
| [34] |
Kezer K, Matsuyama H. 2006. Decrease of river runoff in the Lake Balkhash basin in Central Asia. Hydrological Processes, 20(6): 1407-1423.
doi: 10.1002/hyp.v20:6
|
|
|
| [35] |
Khanal S, Lutz A F, Kraaijenbrink P D A, et al. 2021. Variable 21st century climate change response for rivers in High Mountain Asia at seasonal to decadal time scales. Water Resources Research, 57(5): e2020WR029266, doi: 10.1029/2020WR029266.
|
|
|
| [36] |
Kraaijenbrink P D A Stigter, E E, Yao T D, et al. 2021. Climate change decisive for Asia's snow meltwater supply. Nature Climate Change, 11(7): 591-597.
doi: 10.1038/s41558-021-01074-x
|
|
|
| [37] |
Lievens H, Demuzere M, Marshall H P, et al. 2019. Snow depth variability in the Northern Hemisphere Mountains observed from space. Nature Communications, 10: 4629, doi: 10.1038/s41467-019-12566-y.
pmid: 31604957
|
|
|
| [38] |
Liu Z W, Yang H B. 2021. Estimation of water surface energy partitioning with a conceptual atmospheric boundary layer model. Geophysical Research Letters, 48(9): e2021GL092643, doi: 10.1029/2021GL092643.
|
|
|
| [39] |
Mann H B. 1945. Nonparametric tests against trend. Econometrica, 13(3): 245-259.
doi: 10.2307/1907187
|
|
|
| [40] |
Muhammad S, Thapa A. 2021. Daily Terra-Aqua MODIS cloud-free snow and Randolph Glacier Inventory 6.0 combined product (M*D10A1GL06) for high-mountain Asia between 2002 and 2019. Earth System Science Data, 13(2): 767-776.
|
|
|
| [41] |
Muñoz-Sabater J, Dutra E, Agustí-Panareda A, et al. 2021. ERA5-Land: A state-of-the-art global reanalysis dataset for land applications. Earth System Science Data, 13(9): 4349-4383.
doi: 10.5194/essd-13-4349-2021
|
|
|
| [42] |
Penman H L. 1948. Natural evaporation from open water, bare soil and grass. Proceedings of the Royal Society A-Mathematical and Physical Sciences, 193(1032): 120-145.
|
|
|
| [43] |
Potter N J, Zhang L, Milly P C D, et al. 2005. Effects of rainfall seasonality and soil moisture capacity on mean annual water balance for Australian catchments. Water Resources Research, 41(6): W06007, doi: 10.1029/2004WR003697.
|
|
|
| [44] |
Priestley C H B, Taylor R J. 1972. Assessment of surface heat-flux and evaporation using large-scale parameters. Monthly Weather Review, 100(2): 81-92.
doi: 10.1175/1520-0493(1972)100<0081:OTAOSH>2.3.CO;2
|
|
|
| [45] |
Pritchard H D. 2019. Asia's shrinking glaciers protect large populations from drought stress. Nature, 569(7758): 649-654.
doi: 10.1038/s41586-019-1240-1
|
|
|
| [46] |
RGI Consortium. 2023. Randolph Glacier Inventory-a dataset of global glacier outlines, version 7.0. [2025-03-19]. https://nsidc.org/data/nsidc-0770/versions/7.
|
|
|
| [47] |
Severskiy I, Vilesov E, Armstrong R, et al. 2016. Changes in glaciation of the Balkhash-Alakol Basin, Central Asia, over recent decades. Annals of Glaciology, 57(71): 382-394.
doi: 10.3189/2016AoG71A575
|
|
|
| [48] |
Shean D E, Bhushan S, Montesano P M, et al. 2020. A systematic, regional assessment of High Mountain Asia glacier mass balance. Frontiers in Earth Science, 7: 363, doi: 10.3389/feart.2019.00363.
|
|
|
| [49] |
Siegfried T, Bernauer T, Guiennet R, et al. 2012. Will climate change exacerbate water stress in Central Asia? Climatic Change, 112(3-4): 881-899.
doi: 10.1007/s10584-011-0253-z
|
|
|
| [50] |
Smith T, Bookhagen B. 2018. Changes in seasonal snow water equivalent distribution in High Mountain Asia (1987 to 2009). Science Advances, 4(1): e1701550, doi: 10.1126/sciadv.1701550.
|
|
|
| [51] |
Stigter E E, Litt M, Steiner J F, et al. 2018. The importance of snow sublimation on a Himalayan glacier. Frontiers in Earth Science, 6: 108, doi: 10.3389/feart.2018.00108.
|
|
|
| [52] |
Thevs N, Nurtazin S, Beckmann V, et al. 2017. Water consumption of agriculture and natural ecosystems along the Ili River in China and Kazakhstan. Water, 9(3): 207, doi: 10.3390/w9030207.
|
|
|
| [53] |
Verkaik J, Sutanudjaja E H, Oude Essink G H P, et al. 2024. GLOBGM v1.0: A parallel implementation of a 30 arcsec PCR-GLOBWB-MODFLOW global-scale groundwater model. Geoscientific Model Development, 17(1): 275-300.
doi: 10.5194/gmd-17-275-2024
|
|
|
| [54] |
Xu X B, Yao J Q, Wang N X, et al. 2017. Variation trend of climate change and its effect on annual runoff in the Lake Balkhash Basin, Central Asia. Fresenius Environmental Bulletin, 26(12): 7271-7286.
|
|
|
| [55] |
Yang H B, Yang D W, Lei Z D, et al. 2008. New analytical derivation of the mean annual water-energy balance equation. Water Resource Research, 44(3): 14069, doi: 10.1029/2007WR006135.
|
|
|
| [56] |
Yin J, Slater L J, Khouakhi A, et al. 2023. GTWS-MLrec: Global terrestrial water storage reconstruction by machine learning from 1940 to present. Earth System Science Data, 15(12): 5597-5615.
doi: 10.5194/essd-15-5597-2023
|
|
|
| [57] |
Zhang D W, Cong Z T, Ni G H, et al. 2015. Effects of snow ratio on annual runoff within the Budyko framework. Hydrological Earth System Science, 19(4): 1977-1992.
|
|
|
| [58] |
Zhang Y S, Ohata T, Ersi K, et al. 2003. Observation and estimation of evaporation from the ground surface of the cryosphere in eastern Asia. Hydrological Processes, 17(6): 1135-1147.
doi: 10.1002/hyp.v17:6
|
|
|
| [59] |
Zhao P, Xia Z Q, Chen Q C, et al. 2013. Influence of Kapchagay Reservoir on runoff characteristics and ecological runoff in lower reaches of Ili River. Journal of Hohai University (Natural Sciences), 41(6): 482-487. (in Chinese)
|
|
|
| [60] |
Zhou J, Wang L, Zhang Y S, et al. 2015. Exploring the water storage changes in the largest lake (Selin Co) over the Tibetan Plateau during 2003-2012 from a basin-wide hydrological modeling. Water Resource Research, 51(10): 8060-8086.
doi: 10.1002/wrcr.v51.10
|
|
|
|
Viewed |
|
|
|
Full text
|
|
|
|
|
Abstract
|
|
|
|
|
Cited |
|
|
|
|
| |
Shared |
|
|
|
|
| |
Discussed |
|
|
|
|